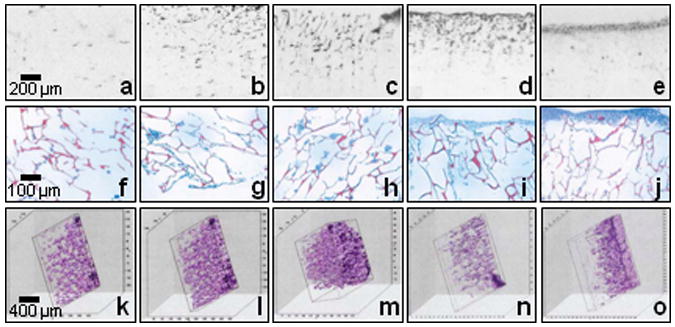
Figure 2.

Two-dimensional OCT images (a-e), their corresponding histological images (f-j) and three-dimensional OCT images under different stages of engineered tissue development: day 1 (a, f, k, l, and m), day 3 (b and g), day 5 (c, h, and n), day 7 (d, i, and o), and day 9 (e and j).
