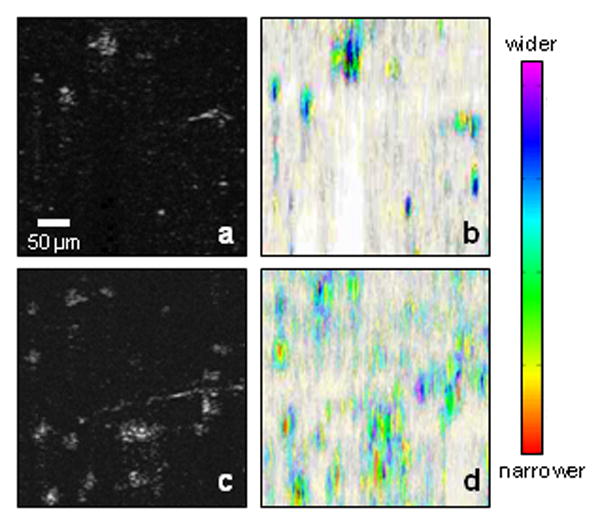
Figure 8.

SOCT images of two types of cells in engineered tissues. (a) Structural OCT image of fibroblasts in a 3-D scaffold. (b) SOCT analysis of (a). (c) Structural OCT image of macrophages in a 3-D scaffold. (d) SOCT analysis of (c). The SOCT images are constructed using the HSV color scale. Central color differences are noted for each cell type, representing differing degrees of optical scattering from cell size, shape, nuclei size, and organelle distribution.
