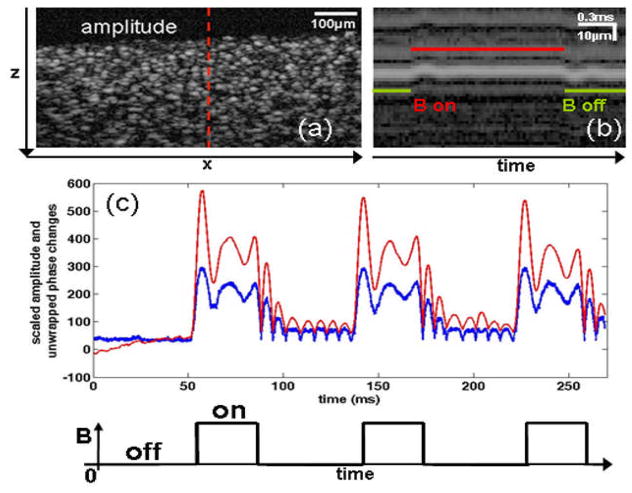
Fig. 2.
Scatterer response upon square-wave modulation of a magnetic field. (a) Two-dimensional (x-z) cross-sectional (B-mode) amplitude OCT image of a silicone sample containing MNPs and TiO2 optical scatterers. The dashed line indicates the location in the sample where M-mode imaging was performed with MM-OCE. (b) M-mode amplitude OCT image of a region of scatterers acquired while the magnetic field was applied in a square-wave pattern. (c) Average time-dependent scatterer changes along one axial position, illustrating both the changes in phase (red) and changes in amplitude (blue) as the magnetic field is applied, relative to an idle state with zero magnetic field.

