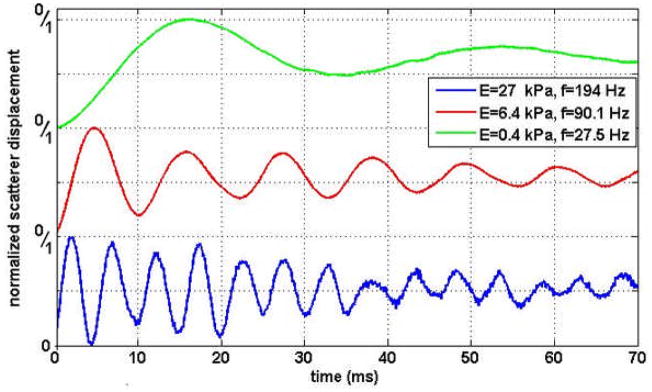
Fig. 4.
Normalized measured displacements from samples of different elastic moduli following a step (off-to-on) transition of the applied magnetic field. Three samples that span a wide range of elastic moduli (measured by indentation: 0.4 kPa [green], 6.4 kPa [red], 27 kPa [blue]) are shown. These sample moduli are characteristic of soft biological tissue, and were chosen to illustrate the natural frequencies of oscillation measured by MM-OCE. The “0/1” labels on the vertical axis are respectively indicating the minimum and maximum of the normalized amplitudes of the displacements traces. As expected, it is observed that as the stiffness of the medium increases, the natural frequency of oscillation of the response increases.

