Abstract
Spectrally-isolated narrowband Cherenkov radiation from commercial nonlinear photonic crystal fibers is demonstrated as an ultrafast optical source with a visible tuning range of 485–690 nm, which complementarily extends the near-infrared tuning range of 690–1020 nm from the corresponding femtosecond Ti:sapphire pump laser. Pump-to-signal conversion efficiency routinely surpasses 10%, enabling multimilliwatt visible output across the entire tuning range. Appropriate selection of fiber parameters and pumping conditions efficiently suppresses the supercontinuum generation typically associated with Cherenkov radiation.
1. Introduction
Numerous efforts have employed femtosecond pump lasers to generate broadband and flat supercontinuum output from photonic crystal fibers (PCF) with a power level on the order of tens of milliwatts [1]. However, many applications, such as multiphoton microscopy and ultrafast spectroscopy, require narrowband ultrashort (<5 ps) pulses of a few milliwatts of average power that are widely tunable across a frequency up-converted region of the pump laser [2]. While selective spectral filtering of the supercontinuum may lead to a useful multi-wavelength pulsed source [3], the elongated temporal width and the decreased pulse energy produce unavoidable adverse effects. The more attractive solution is to efficiently convert input pump power into the targeted spectral band (signal) using fiber-based nonlinear frequency up-conversion techniques. One well-known technique is the four-wave mixing excited at the slightly normal dispersion regime of the fiber, which has been implemented in the form of an optical parametric oscillator [4, 5]. Wide tunability of the signal wavelength in the near-infrared [4] and the visible [5] can be achieved by tuning the pump wavelength across a relatively narrow (~20 nm) spectral region. Nonetheless, the pulse walk-off effect and the supercontinuum onset have largely restricted the pump-to-signal conversion efficiency to within 2%, preventing the generation of a multimilliwatt-level signal. A recent study has attained 7% conversion efficiency and a multimilliwatt signal by fulfilling the phase-matching condition of the four-wave mixing through an intermodal scheme [6]. Unfortunately, such scheme does not afford the wide tunability of the signal by finely adjusting the pump wavelength, and therefore the signal wavelength tunability must resort to a series of PCFs with different dispersion profiles.
Cherenkov radiation (CR) mediated by fiber solitons, also called dispersive wave generation, non-solitonic radiation, or soliton-induced resonant emission, can realize tunable frequency up-conversion and/or a multimilliwatt signal. Knox and co-workers introduced submillimeter-scale dispersion micromanagement into a short (~1 cm) PCF to generate femtosecond visible pulses from a Ti:sapphire laser [7, 8]. Unfortunately, the wavelength tunability of the pulses also relied on a series of PCFs with different dispersion designs [8], which required a dedicated fiber-tapering facility (including a CO2 laser) to fabricate. As to the underlying mechanism, the individual roles of CR and four-wave mixing remain rather unclear. Leitenstorfer and co-workers used exclusively CR from a dispersion-shifted germanosilicate fiber to up-convert the 1.55 μm wavelength of an amplified femtosecond Er:fiber laser into the 1130–1300 nm region [9], and subsequently frequency-doubled to the 520–700 nm visible region [10], while the wavelength tunability was conveniently achieved by tuning the chirp of the pump laser. However, the germanosilicate fiber required special dispersion engineering [11] and may be susceptive to structural change [12] due to its well-known photosensitivity [13]. Additionally, the technique demands a specially-designed pump laser [14], and in the case of the visible signal, a specific frequency-doubling crystal [10]. Zheltikov and co-workers also invoked CR from birefringent PCFs to frequency up-convert the 820-nm and 1.24-μm pump wavelengths into the visible region [15–17]. Although the birefringence of fibers can be employed to produce different frequency-shifted signals, the signal wavelength is not strictly tunable either due to a limited tuning range [15] or the broadened signal spectrum [16, 17].
While switching the pump polarization can lead to slight tunability of the CR wavelength [15], the more attractive solution is tuning the pump wavelength since such tunability has been demonstrated at low pump (peak) powers to cover a wide spectral range [18, 19]. Unfortunately, increased pump powers tend to initiate supercontinuum around the signal band [15, 20], and therefore compromise the pump-to-signal conversion selectivity. One explanation of the emergence of the supercontinuum is that sequentially ejected red-shifted fundamental solitons emit a mixture of resonant blue-shifted CR of distinct frequencies [21]. Thus, CR has been considered as one mechanism initiating the blue edge of the supercontinuum [1], and at moderate pump powers, has appeared more as an irregular broadband feature [3, 22] than a narrowband line profile. Somewhat surprisingly, we demonstrate below that supercontinuum-free widely-tunable multimilliwatt CR with a narrowband line profile can be generated in a short nonlinear PCF by largely detuning the pump wavelength of a Ti:sapphire laser from the zero-dispersion wavelength (ZDW) of the PCF. Such well-behaved CR allows the near-infrared tuning range of a Ti:sapphire laser to be effectively extended to the entire visible region, using a simple experimental setup and well-characterized PCFs that can be designed in a straightforward manner.
2. Experiment
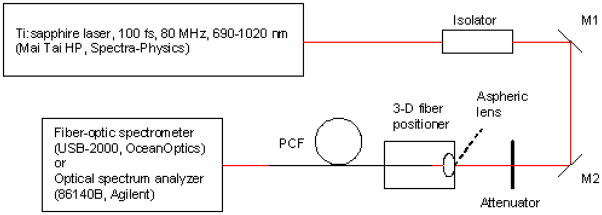
Our simple fiber-pumping setup is built upon a widely-tunable wavelength Ti:sapphire laser, as shown in Fig. 1. The input power P0, taken as the laser power between the neutral density attenuator and the aspheric lens (Fig. 1), is varied by an attenuator within 1–150 mW. Although our experiments employ a variety of fiber lengths, PCF types, input powers and pump wavelengths, the free-space-to-fiber coupling efficiency η is consistently attained at ~50%, measured as the ratio of the power exiting the fiber to the input power. The laser pulses have an initial FWHM width of ~170 fs, or a hyperbolic-secant pulse-width T0 of ~100 fs, but are elongated to ~300 fs (FWHM) by the isolator before entering the fiber, as measured by a laboratory-built autocorrelator. The spectrum of the exiting light is monitored by a fiber-optic spectrometer and an optical spectrum analyzer in the spectral range of 400–1050 nm and 700–1700 nm, respectively (Fig. 1).
Fig. 1.
Schematic of the experimental setup.
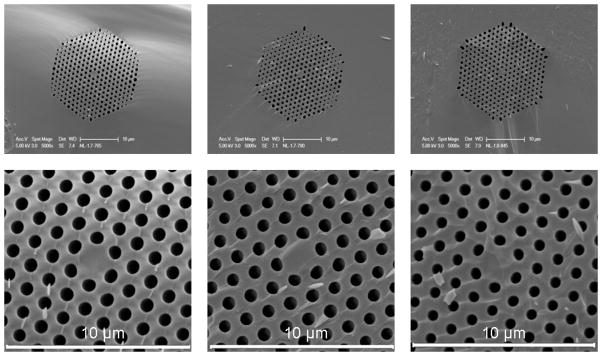
Scanning electron microscopy (SEM) images of the cross-sections of the PCFs (Crystal Fibre A/S, Denmark) are shown in Fig. 2.
Fig. 2.
SEM images of the cross sections of NL-1.7-770 (left), NL-1.7-790 (middle), and NL-1.8-845 (right). The bottom panels are the magnified images of the upper panels.
Each PCF consists of hexagonally-arranged holes with uniform diameter d (at least for the inner 4 rings of holes), separated by a constant pitch Λ. The absence of the central hole defines the fiber core where light is confined, while the relatively small d/Λ ratio (i.e., air-fill fraction) extends the single-mode transmission deep into the short-wavelength edge [23]. The specifications of the PCFs are summarized in Table 1.
Table 1.
Properties of the photonic crystal fibers.
| Fiber type | NL-1.7-770 | NL-1.7-790 | NL-1.8-845 |
|---|---|---|---|
| ZDW | 770 nm | 790 nm | 845 nm |
| nonlinear coefficient γ | 110 Wkm−1 | 105 Wkm−1 | 98 Wkm−1 |
| mode field diameter | 1.49 μm | 1.53 μm | 1.59 μm |
| cutoff wavelength | 745 nm | 680 nm | 525 nm |
| material | pure silica | pure silica | pure silica |
| ZDWI (measured) | 1400±20 nm | 1330±20 nm | 1190±20 nm |
| Infrared CR (measured) | 1560±10 nm | 1470±10 nm | 1340±10 nm |
| pitch Λ (derived) | 1.30±0.02 μm | 1.30±0.02 μm | 1.30±0.02 μm |
| d/Λ ratio (derived) | 0.60±0.01 | 0.56±0.01 | 0.50±0.01 |
| Infrared CR (calculated) | 1535±10 nm | 1450±10 nm | 1310±10 nm |
3. Supercontinuum-free output
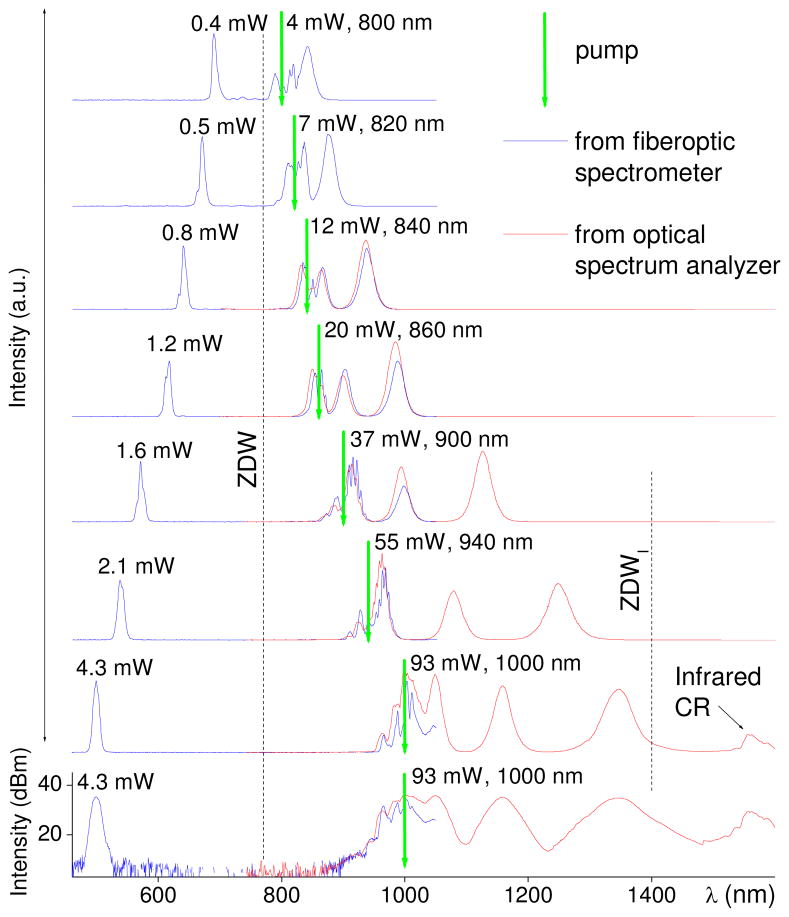
Typical output spectra from a 71-cm long NL-1.7-770 fiber as a function of the pump wavelength and the input power is shown in Fig. 3.
Fig. 3.
Dependence of the visible CR output power and overall spectra from a 71-cm long NL-1.7-770 fiber for varying pump-wavelength/input-power.
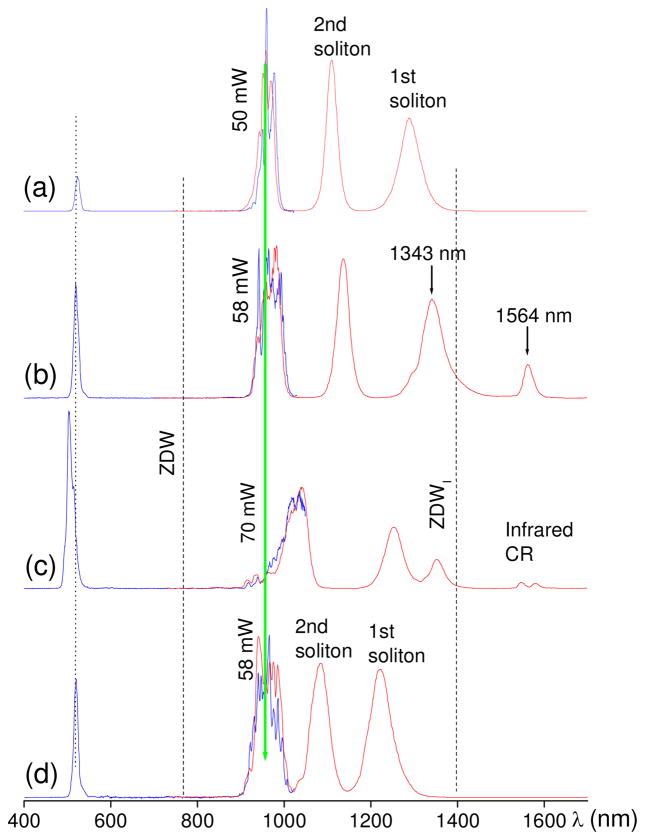
The spectrum obtained from the fiber-optic spectrometer (corrected for the lower detector responsiveness at the red edge) approximates that from the spectrum analyzer in the overlapping region of 700–1050 nm, ensuring the overall consistency of the amplitudes across wide spectral regions. While the spectrum at wavelengths longer than the pump wavelength exhibits the expected signature of dynamically evolved solitons [24], the spectrum at wavelengths shorter than the pump wavelength displays only a single narrowband emission having a milliwatt-level power (measured after removing the infrared power by 700-nm cutoff filters), which illuminates the fiber with visible scattered light. The narrowband emission generally undergoes a further blue-shift with increasing pump wavelength (Fig. 3). Also, at a constant pump wavelength of 960 nm, the narrowband emission undergoes a blue-shift with increasing input power, and gains amplification exponentially beyond a threshold input power at the expense of the output power of the solitons [Fig. 4(a)–4(c)].
Fig. 4.
(a)–(c) Output spectra from a 71-cm long NL-1.7-770 fiber at a constant pump wavelength of 960 nm and different pump powers; (d) Output spectrum at a pump wavelength of 960 nm and a pump power of 58 mW after the 71-cm fiber is shortened to 21-cm.
Phenomenologically, it is tempting to attribute the observed visible narrowband emission to the blue-shifted pulse trapped by the first and the strongest fundamental soliton undergoing the largest red-shift [25–27]. This interpretation predicts that the visible emission undergoes continuous blue-shift along the fiber to attain a group velocity that matches the decreasing group velocity of the red-shifted soliton, i.e., the blue and red edges of the output spectrum are group-index-matched. To investigate this, we use a cut-back technique to shorten the fiber to 21 cm, and conduct the same experiment of Fig. 4(b). The output spectrum from the shortened fiber reveals no wavelength shift (within 2 nm) for the visible emission, even though the first soliton suffers considerable (~120 nm) red-shift along the fiber [Fig. 4(d)]. Also, the power of the visible emission remains the same. We have verified this absence of wavelength shift and power variation for a variety of experimental conditions given in Fig. 3, indicating that the visible emission is not due to the pulse trapping. On the other hand, all these results are consistent with the CR nature of the emission [18, 19, 28]. Because the generation of the visible CR pulse is completed within the first few centimeters of the fiber, the pulse simply undergoes normal dispersion further down the fiber and suffers no wavelength shift or power variation [19, 28].
Whenever the red-wavelength tail of the most red-shifted soliton approaches 1400±20 nm, an emission at 1560±10 nm emerges [Fig. 3, 4(b)]. A further increase of the input power does not allow the red-shifted soliton to cross this wavelength boundary [Fig. 4(c)]. This effect, known as soliton self-frequency shift cancellation [29], assigns the 1560-nm emission to a red detuned CR of the soliton and the 1400-nm boundary to an infrared zero-dispersion wavelength of the fiber, denoted as ZDWI. These values are consistently measured at a variety of pump wavelengths and input powers, and listed in Table 1 as the properties specific to the fiber. In summary, any pronounced feature in the output spectrum is spectrally well-isolated and can be assigned either to a soliton (experiencing significant Raman self-frequency shift or remaining close to the pump wavelength) or its secondary emission of CR (propagating in the visible or the infrared normal dispersion regimes). Thus, we do not classify this spectrum as supercontinuum, and argue that the simple combination of soliton and CR does not necessarily induce supercontinuum generation, even though their spectral regions can span a broad bandwidth (>1000 nm) comparable to a typical supercontinuum. The supercontinuum-free operation requires detuning the pump wavelength far away from the ZDW and progressively decreasing the input power when the pump wavelength approaches the ZDW (Fig. 3). By employing the same strategy, such condition can be attained in other nonlinear PCFs including a 40-cm NL-1.7-790 fiber and a 40-cm NL-1.8-845 fiber, which have measured ZDWI and infrared CR values listed in Table 1.
Within the limited dynamic detection range of the fiber-optic spectrometer (~35 dB), no indication of supercontinuum onset could be detected in the log-scale around the visible CR of multimilliwatt power (Fig. 3). This CR is blue-shifted by 502 nm from the pump wavelength, which itself is detuned from the ZDW by 230 nm into the deeply anomalous dispersion region. Both values are limited only by the red-wavelength edge of the wavelength tuning range of the laser. Previous studies in the context of supercontinuum generation have pointed out that the pump wavelength should not be detuned far away from the ZDW of the fiber for effective CR amplification because this occurs only if CR overlaps spectrally with the multisoliton state of the input pulse undergoing strong temporal compression [19, 30, 31]. In contrast, Fig. 3 shows that the effect of exponential amplification of CR with increasing input power easily overcomes such effect of inefficient spectral overlapping, allowing strong emission of CR with large up-converted frequency.
4. Phase-matching condition
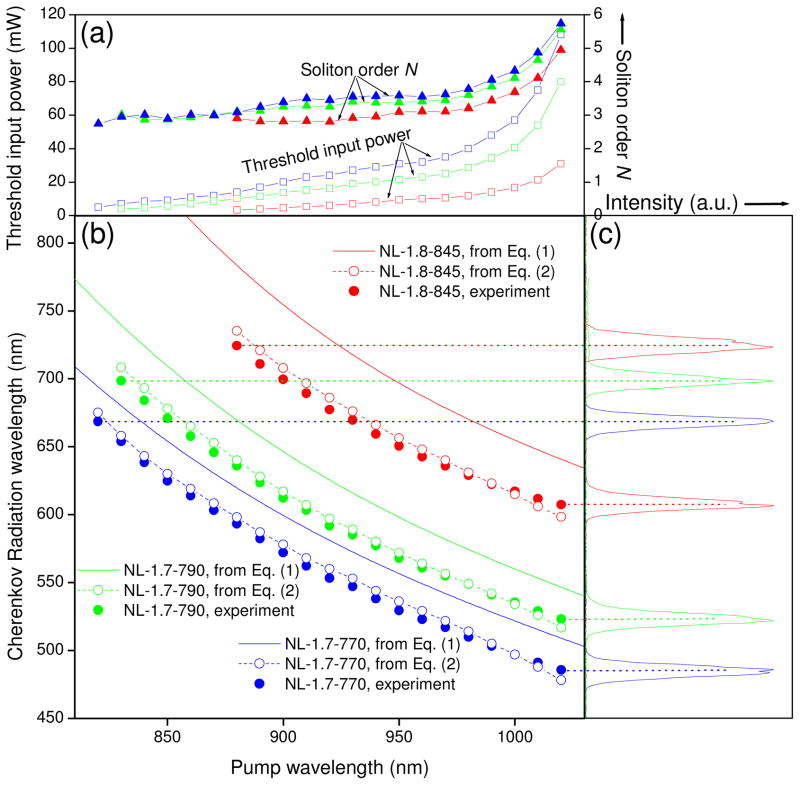
At a given pump wavelength, in contrast to Fig. 3 in which the input power is set to generate relatively strong CR, we lower the input power (by up to 50%) toward a threshold where the CR is minimally observable. For the same three fibers (i.e., the 71-cm NL-1.7-770 before the cut-back, the 40-cm NL-1.7-790, and the 40-cm NL-1.8-845), the threshold input powers, the corresponding CR wavelengths, and CR spectra as functions of the pump wavelength are shown in Fig. 5(a), (b), and (c), respectively. The threshold input power at a given pump wavelength and the tuning range of the CR differs considerably among the fibers [Fig. 5(a), 5(b)]. The CR, however, has a Gaussian-like spectrum with a nearly constant bandwidth (FWHM) of ~10 nm [Fig. 5(c)], regardless of the fiber type and the pump wavelength. All these results can be understood from the dispersion profiles of the fibers.
Fig. 5.
(a) Threshold input power (open squares) or soliton order (solid triangles) of CR for a 71-cm NL-1.7-770 (blue curve), a 40-cm NL-1.7-790 (green curve) or a 40-cm NL-1.8-845 (red curve) fiber. (b) Observed or calculated CR wavelength as a function of pump wavelength for the three fibers. (c) Observed CR spectrum as a function of pump wavelength for the three fibers.
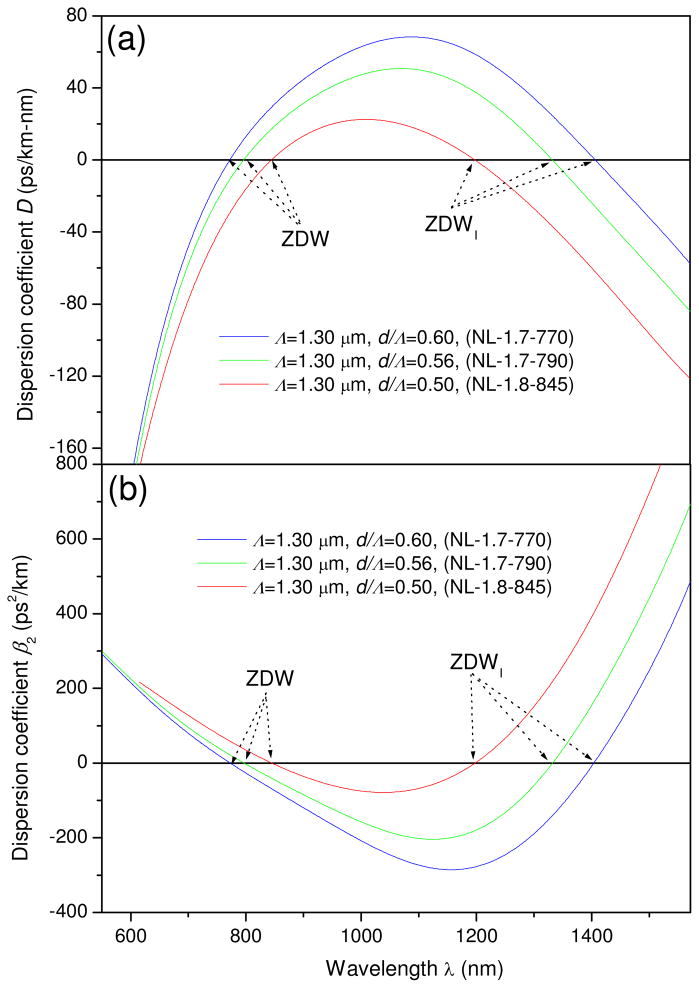
The cross-sectional images of the fibers (Fig. 2) can be used to determine Λ and d/Λ, which permit the dispersion profile of the fibers to be calculated from a multipole method [32]. This profile has little dependence on the number of rings of holes surrounding the guided core (10 for the three PCFs shown in Fig. 2) if this number is larger than 3, and therefore the actual calculation is always performed by assigning an integer of 4 to this number. Although the cross-sectional image itself can only yield highly approximate values of Λ and d/Λ, the corresponding dispersion profile must reproduce the manufacturer-specified ZDW (presumably measured by the time-of-flight method from long fiber) and the measured ZDWI (Table 1). These two constraints allow the two values to be accurately refined for each of the three fibers (Table 1), and the corresponding dispersion profile can be determined [Fig. 6(a), (b)].
Fig. 6.
(a) Dispersion coefficient D or (b) β2 as a function of wavelength for the three fibers.
The dispersion profile can in turn be used to predict the CR wavelength, using the phase-matching condition involving the source soliton and its resonant CR [21]. If the nonlinear phase of the soliton is ignored, the condition can be written as [19],
| (1) |
where βn is the n-th order derivative of the propagation constant of the fiber calculated at the central frequency of the soliton ωS, while ωCR is the central frequency of the CR. In the numerical calculation of ωCR, ωS is taken as the pump frequency ωP while βn up to the 9-th order are derived from the known profile of the dispersion coefficient β2 [Fig. 6(b)]. The calculation produces the function between the CR wavelength and the pump wavelength for each of the three fibers [Fig. 5(b)]. Although Eq. (1) overestimates the CR wavelength in comparison to the observed values, it satisfactorily predicts the overall CR tuning ranges of the three fibers. Fine adjustments of Λ and d/Λ may slightly minimize the overestimation, but at the cost of generating large discrepancy between the predicted and measured ZDW and ZDWI values. Since the absolute value of the slope of this function approximates unity [Fig. 5(b)], the CR spectrum should approximate the pump spectrum, which has a Gaussian-like spectrum of ~10 nm bandwidth (FWHM) across the tuning range of 820–1020 nm. This explains why the observed CR from each of the three fibers also has a Gaussian-like spectrum with a nearly constant bandwidth (FWHM) of ~10 nm [Fig. 5(c)].
Improved prediction of CR wavelength must take into account the nonlinear phase of the soliton, which was previously estimated in a rather inconsistent manner [7, 8, 18, 19, 28, 31, 33]. Following ref. 28, we write the condition as
| (2) |
where γ is the nonlinear coefficient of the fiber (Table 1), and PS is the peak power of the source soliton (not that of the initial input pulse). This applies to the situation where an input power is large enough to excite higher-order solitons because the initial multi-solitonic state of the pump pulse can be approximated by a single fundamental soliton [28]. For a higher-order soliton of order N less than or equal to 5, the input energy is primarily coupled into the first and the strongest constituent soliton of the higher-order soliton [34], and therefore PS can be taken as the peak intensity of this constituent soliton. This leads to [1]
| (3) |
and
| (4) |
where Pin is the peak power of the pump pulse which can be calculated from the known (average) input power P0, pulse width T0, laser repetition rate (80 MHz) and free-space-to-fiber power coupling efficiency η (50%). The soliton frequency ωS is taken as the pump frequency ωP. Despite the large difference among the threshold input powers of the three fibers at a given pump wavelength, Eq. (4) calculates that the measured threshold input power corresponds to N = 3 at the blue wavelength end of the tuning range and N = 5 at the red wavelength end of the tuning range [Fig. 5(a)]. The large threshold input power of NL-1.7-770 is offset by the large |β2| of NL-1.7-770 while the small threshold input power of NL-1.8-845 is offset by the small |β2| of NL-1.8-845 [Fig. 6(b)]. In other words, the threshold for CR generation depends on the order of the excited high-order soliton N rather than the absolute value of the input power.
Despite the uncertainty of the above model, the CR wavelengths predicted by Eq. (2) are in good agreement with the observed CR wavelengths [Fig. 5(b)]. It should be emphasized that the nonlinear phase of the soliton can never be neglected for accurate prediction even though the threshold input power is as small as a few milliwatts. Because the threshold input power does not excite very high-order solitons (N > 6), the spectral recoil effect that deviates ωS from the pump frequency is small [28], justifying the equalization of the two in the model. We note that two previous studies attempted to correlate the observed pump wavelength-dependent CR wavelength with the phase-matching condition [18, 19]. However, no definitive quantitative agreement was obtained due to the uncertainty of the dispersion profile of the fiber [18] or the limited number of experimental data [19].
Due to the coexistence of ZDW and ZDWI in the fibers there are two solutions for the CR wavelength; one in the visible and another one in the infrared normal dispersion region [31]. To predict the wavelength of the infrared CR for NL-1.7-770, we assign 1343 nm to ωS [Fig. 4(b)] in Eq. (1). The CR wavelength is predicted at 1539 nm, in good agreement with the observed value of 1564 nm [Fig. 4(b)]. The relatively small discrepancy can be attributed to the nonlinear phase of the soliton. The similar agreement can be obtained for the other two fibers with results summarized in Table 1. It is interesting to note that the onsets of the visible CR and the infrared CR can both be attributed to the first soliton constituting the excited higher-order soliton. The visible CR is generated over a narrow range of propagation distances within the first few centimeter of the fiber where the high-order soliton fission begins and the first soliton emerges [19, 28], while the infrared CR is generated further down the fiber where the first soliton approaches the ZDWI due to the Raman self-frequency shift.
5. Supercontinuum onset
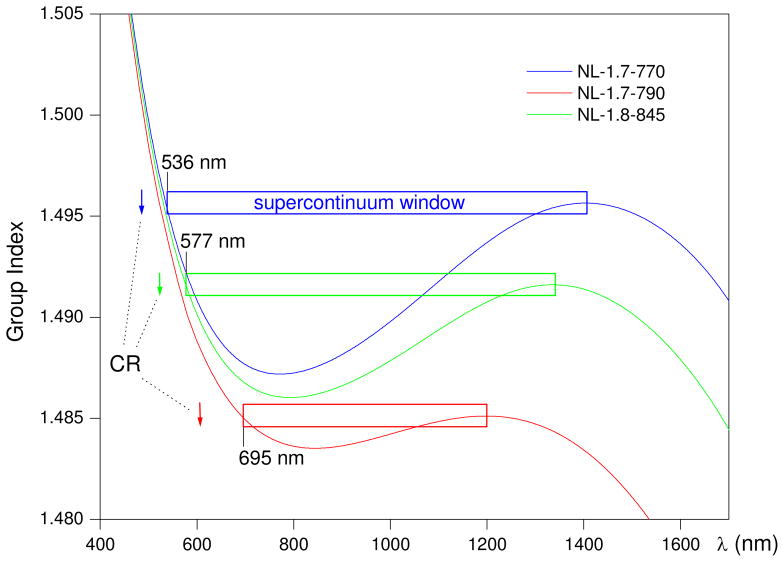
The above evidence supports that it is the CR that dictates the blue-edge of the fiber output spectrum. This conclusion appears to contradict the results from some recent studies that have attributed the blue-edge of fiber output spectrum to the soliton-like wave trapped by the soliton residing at the group-index matched red-edge of the spectrum [26, 27]. Such phenomenon of pulse trapping and group-index matching was observed earlier without generating supercontinuum [35], but finds important application in extending the blue-edge of the supercontinuum [36]. To examine this contradiction, we promote the supercontinuum generation by tuning the pump wavelength to the ZDW of the fiber. Using an input power up to 200 mW, we observe the supercontinuum generation across a broad visible region rather than the emission at one narrow visible band. However, the blue-edge of the supercontinuum can not extended beyond 530 nm, 575 nm, and 680 nm for the NL-1.7-770, NL-1.7-790, and NL-1.8-845 fiber, respectively. It should be noted that the supercontinuum-free operation by simply red-shifting the pump wavelength to 1020 nm is able to generate shorter wavelength components of 485 nm, 523 nm, and 607 nm for the NL-1.7-770, NL-1.7-790, and NL-1.8-845 fiber, respectively [Fig. 5(b)]. This seemingly surprising result can be readily explained by the group index profiles of the three fibers in Fig. 7, which are calculated by the same multipole method that produces the corresponding dispersion profiles [Fig. 6(a), 6(b)].
Fig. 7.
Wavelength dependent group index profile and the corresponding supercontinuum window of each of the three fibers. Each vertical arrow represents the location of the generated CR at a pump wavelength of 1020 nm.
The noticeable feature of these group index profiles is the existence of a peak in the 1100–1500 nm spectral region, which corresponds to the ZDWI. According to the concept of the group-index matching between the blue and red edge of the supercontinuum [36], how far the supercontinuum can be extended to the blue is determined by how far the self frequency-shifting solitons can travel into the red. Because the effect of soliton self-frequency shift cancellation forbids the solitons to cross the ZDWI boundary, this boundary defines a window that the supercontinuum can be spectrally extended (Fig. 7). The presence of the supercontinuum window for each of these three fibers confirms the observed limit for the blue extension of the supercontinuum. Thus, pumping the fiber at ZDW does generate the supercontinuum whose blue-edge is dictated by the trapped soliton-like wave. On the other hand, the relatively narrow supercontinuum window (i.e., the fact that the fiber is a poor candidate for supercontinuum applications) provides a unique opportunity to generate phase-matched CR to the blue of this window by deeply detuning the pump wavelength into the anomalous dispersion region. For example, the CR from the fiber pumped at 1020 nm [Fig. 5(b)] falls well outside of the corresponding supercontinuum window (Fig. 7). In this case, the blue-edge of the fiber output spectrum is dictated by the CR. The generated CR pulse has a group velocity that is slower than the slowest solition undergoing the largest red-shift (Fig. 7). The CR pulse and all the solitons propagate independently along the fiber without interacting with each other, leading to a supercontinuum-free output spectrum.
When the pump wavelength approaches the ZDW of the fiber from the anomalous dispersion side, the phase-matched CR eventually falls inside the supercontinuum window. In this case, the self-frequency shifting solitons may walk over the CR pulse temporally to induce supercontinuum onset. The supercontinuum components to the blue of the CR may be generated by cross-phase modulation [33] and pulse trapping [26, 27, 35], while those to the red by four-wave mixing between dispersive waves and solitons [25]. To avoid the supercontinuum onset, the input power must be lowered until the spectrally-isolated CR becomes well-resolved (Fig. 3), as the CR has been known as the initial step to induce the blue-edge of the supercontinuum [18]. This justifies the operation procedures of the supercontinuum-free condition discussed above.
To summarize, whether the blue-edge of the fiber output spectrum is dictated by the trapped radiation or the CR depends on the pump wavelength, pump power, fiber modal structure, fiber length, etc. The reason why the former is valid in the previous studies [26, 27, 36] is because the supercontinuum generation at high pump powers has obscured the CR. This obscuring effect is particularly severe due to the selection of the fibers that have broad supercontinuum windows to enclose the CR. In contrast, the selection of the fibers that have narrow supercontinuum windows and the operation under the supercontinuum-free condition in our experiments always ensures the validity of the later. We believe such operating condition represents the simplest situation where a minimum number of physical effects (i.e., soliton generation and its secondary emission of CR) are employed to produce an output spectrum that can span the bandwidth of a supercontinuum. This allows the slowly varying envelop approximation of the Generalized Nonlinear Schrodinger equation to be strictly tested [1] so that the surprisingly strong intensity of CR may be explained [19]. The condition can serve as the starting point to understand the origin of the supercontinuum generation. Various physical effects known to induce supercontinuum may subsequently be individually examined.
6. Multimilliwatt operation
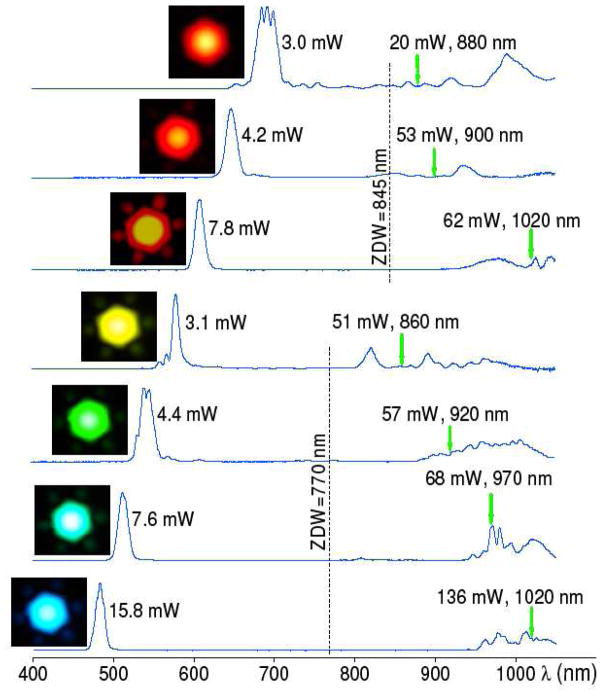
The above experiments performed on relatively long (>30 cm) fiber and low input power are useful to clarify the physical mechanism of the CR generation. However, the condition of shortened fiber and increased input power is favored in the practical application of the CR, which demands multimilliwatt output power without introducing unnecessary temporal dispersion to the CR pulses. The typical CR spectrum (from the fiber-optic spectrometer) and power as functions of the pump wavelength and the input power are shown in Fig. 8 for a 7.2-cm NL-1.7-770 fiber and a 8.3-cm NL-1.8-845 fiber. In the case of the NL-1.7-770 fiber, 15.8 mW of 482-nm supercontinuum-free CR can be generated at a pump wavelength of 1020 nm and an input power of 136 mW, corresponding to a rather moderate input peak intensity of 8.5 kW. When the pump wavelength is progressively shifted toward the ZDW to generate the CR of longer wavelengths, the input power must be lowered to suppress the supercontinuum onset, and the CR power is therefore decreased (Fig. 8). When the pump wavelength reaches 860 nm, the supercontinuum-free operation can only support 3.1 mW of 578-nm CR. During this process, the Gaussian-like spectrum of the CR evolves into a relatively irregular spectral peak, suggesting the influence from the supercontinuum onset. Thus, the pump wavelength must be detuned toward the deeply anomalous dispersion region of the fiber to obtain strong and clean CR.
Fig. 8.
CR spectrum/power as a function of pump-wavelength/input-power for an 8.3-cm NL-1.8-845 fiber (upper 3 traces) and a 7.2-cm NL-1.7-770 fiber (lower 4 traces). The insets represent the far-field images of the exiting light from the fibers.
The results from the NL-1.8-845 fiber are qualitatively similar, except that it is less prone to the supercontinuum onset when the pump wavelength approaches the ZDW of the fiber (Fig. 8). We compare the results from hexagonal PCFs with a relatively low air-fill fraction (i.e., the three fibers in Table 1) and hexagonal PCFs with a high air-fill fraction, with both groups having similar mode areas and fiber lengths (~10 cm). The PCFs having a lower air-fill fraction are always less prone to the supercontinuum onset. This may be because the PCF that has a lower air-fill fraction usually has a narrower supercontinuum window (Fig. 2, 7). In addition, PCFs with a low air-fill fraction (or small d/Λ value) have the advantage of suppressing multimode behavior [23], which is responsible for the multimode CR generation from a birefringent PCF with a high air-fill fraction [15]. In contrast, the far-field images of the CR from the NL-1.7-770 fiber and the NL-1.8-845 fiber exhibit the typical profile of the fundamental PCF mode (Fig. 8).
The tuning ranges of the multimilliwatt CR from the two fibers complement each other to cover a visible spectral range of 485–690 nm (Fig. 8). It should be noted that our Ti:sapphire laser with a tuning range of 690–1020 nm permits second harmonic generation across 345–510 nm, but leaves a spectral gap of 510–690 nm inaccessible. The frequency up-conversion from the two fibers nicely fills this gap. The spectrogram of the CR pulses, the possibility of pulse compression, and the influence from the supercontinuum onset will be studied in the near future, using techniques such as cross-correlation frequency resolved optical gating [37]. It should be noted that several independent simulations have shown that the pulse width of the CR generated from a ~10 cm PCF is on the order of a few picoseconds [19, 28, 30]. The implementation of such a visible ultrafast CR source is simple and cost-effective (Fig. 1). Conversion efficiency from the pump to the CR signal is typically ~10% (Fig. 8), which compares favorably with optic parametric amplifier-based techniques.
The above approach realizes the tunability of the CR source mainly through tuning the pump wavelength. The excellent beam pointing stability of the commercial pump laser allows fast tuning of the CR wavelength within the tuning range of the PCF (routinely achieved in a few tens of seconds). By selecting a PCF with a smaller ZDW, tunable ultraviolet CR may be produced. An alternative approach to implement the tunable CR source is to pump a series of PCFs with ZDWs ranging from 700 to 900 nm at a constant pump wavelength of 1020 nm (i.e, at the red wavelength edge of the tuning range of the Ti:sapphire laser). The >100 nm spectral separation between the ZDWs and the pump wavelength supports robust supercontinuum-free operation and promotes strong and clean CR generation. The design of the PCFs follows the straightforward fashion as described above. The PCFs can be mounted parallel on one specially designed fiber launcher for easy optical alignment. The greatest advantage of this alternative approach is that the widely-tunable Ti:sapphire laser can be replaced by a compact and cost-effective femtosecond source with a fixed wavelength around 1000 nm (e.g., commercially available Nd:Glass femtosecond laser or ytterbium-doped fiber laser). The module of parallel-mounted PCFs adds to such compact source the capability of a widely-tunable visible picosecond laser, or femtosecond laser if the CR pulse is compressible. Presently, the tunable visible ultrafast pulses are mainly generated from Ti:sapphire laser-pumped optical parametric oscillators or argon laser-pumped dye lasers, both of which are bulky and expensive.
7. Conclusions
We demonstrate that the CR from PCFs can serve as an alternative frequency up-conversion technique to the well-known four-wave mixing, and can provide an up-converted frequency-shift equivalent to a >500 nm wavelength blue-shift from a ~1000 nm source. Such CR, if not obscured by supercontinuum generation, is narrowband in nature and can attain multimilliwatt power levels. The CR wavelength can be tuned either by varying the pump wavelength of the femtosecond source laser or by switching PCFs with different dispersion properties. The phase-matching condition of the CR along with a rigorous multipole method of a PCF mode solver can be used to accurately predict the CR wavelength at low input powers. This allows straightforward design of PCFs to produce the intended CR wavelengths. The device that realizes the frequency up-conversion technique is simple and cost-effective, while pump-to-signal conversion efficiency compares favorably to that of four-wave mixing. The technique is particularly useful for generating visible ultrafast pulses, which are rather difficult to produce conventionally using cumbersome laser configurations. These pulses may be useful in ultrafast spectroscopy, fluorescence lifetime imaging, multiphoton microscopy, etc. With this technique, operational capability can be greatly enhanced for a widely-tunable near-infrared femtosecond Ti:sapphire laser or a compact femtosecond laser operating at ~1000 nm, or other ultrafast lasers operating at various wavelengths.
The key to the frequency up-conversion technique is the suppression of supercontinuum generation. Supercontinuum generation happens when the pump wavelength is close to ZDW, so the input pulse sustains a high peak intensity over a considerable length, which together with the tight confinement of mode field by the high air-fill fraction cladding, enhances a variety of nonlinear effects. Consistently, the frequency up-conversion technique selects the PCFs with relatively small air-fill fractions, detunes the pump wavelength deep into the anomalous dispersion regime, and keeps the pump power sufficiently low to suppress the supercontinuum generation. The theoretical importance of this technique lies in the output spectra from relatively long PCFs, which can be deconstructed into a minimum of constituent nonlinear processes, but spans an unexpectedly broad bandwidth. Such condition provides an excellent opportunity to test the theoretical models governing the propagation of ultrashort pulses in optical fibers.
Acknowledgments
This work was supported in part by grants from the NIH (1 R21 CA115536, Roadmap Initiative 1 R21 EB005321, and NIBIB 1 R01 EB005221, S.A.B.), and from NSF (BES 03-47747 and BES 06-19257, S.A.B.).
Footnotes
OCIS codes: (190.4370) Nonlinear optics, fibers; (060.5295) Photonic crystal fibers; (190.5530) Pulse propagation and solitons
Contributor Information
Haohua Tu, Email: htu@illinois.edu.
Stephen A. Boppart, Email: boppart@illinois.edu.
References and links
- 1.Dudley JM, Genty G, Coen S. Supercontinuum generation in photonic crystal fiber. Rev Mod Phys. 2006;78:1135–1184. [Google Scholar]
- 2.Knight JC, Skryabin DV. Nonlinear waveguide optics and photonic crystal fibers. Opt Express. 2007;15:15365–15376. doi: 10.1364/oe.15.015365. http://www.opticsinfobase.org/oe/abstract.cfm?URI=oe-15-23-15365. [DOI] [PubMed]
- 3.Li D, Zheng W, Qu JY. Two-photon autofluorescence microscopy of multicolor excitation. Opt Lett. 2009;34:202–204. doi: 10.1364/ol.34.000202. http://www.opticsinfobase.org/abstract.cfm?URI=ol-34-2-202. [DOI] [PubMed]
- 4.Deng Y, Lin Q, Lu F, Agrawal GP, Knox WH. Broadly tunable femtosecond parametric oscillator using a photonic crystal fiber. Opt Lett. 2005;30:1234–1236. doi: 10.1364/ol.30.001234. http://www.opticsinfobase.org/ol/abstract.cfm?URI=ol-30-10-1234. [DOI] [PubMed]
- 5.Xu YQ, Murdoch SG, Leonhardt R, Harvey JD. Widely tunable photonic crystal fiber Fabry-Perot optical parametric oscillator. Opt Lett. 2008;33:1351–1353. doi: 10.1364/ol.33.001351. http://www.opticsinfobase.org/ol/abstract.cfm?URI=ol-33-12-1351. [DOI] [PubMed]
- 6.Tu H, Jiang Z, Marks DL, Boppart SA. Intermodal four-wave mixing from femtosecond pulse-pumped photonic crystal fiber. Appl Phys Lett. 2009;94:101109. doi: 10.1063/1.3094127. [DOI] [PMC free article] [PubMed] [Google Scholar]
- 7.Lu F, Deng Y, Knox WH. Generation of broadband femtosecond visible pulses in dispersion-micromanaged holey fibers. Opt Lett. 2005;30:1566–1568. doi: 10.1364/ol.30.001566. http://www.opticsinfobase.org/ol/abstract.cfm?URI=ol-30-12-1566. [DOI] [PubMed]
- 8.Lu F, Knox WH. Generation, characterization, and application of broadband coherent femtosecond visible pulses in dispersion micromanaged holey fibers. J Opt Soc Am B. 2006;23:1221–1227. http://www.opticsinfobase.org/abstract.cfm?URI=josab-23-6-1221.
- 9.Tauser F, Adler F, Leitenstorfer A. Widely tunable sub-30-fs pulses from a compact erbium-doped fiber source. Opt Lett. 2004;29:516–518. doi: 10.1364/ol.29.000516. http://www.opticsinfobase.org/ol/abstract.cfm?URI=ol-29-5-516. [DOI] [PubMed]
- 10.Moutzouris K, Adler F, Sotier F, Träutlein D, Leitenstorfer A. Multimilliwatt ultrashort pulses continuously tunable in the visible from a compact fiber source. Opt Lett. 2006;31:1148–1150. doi: 10.1364/ol.31.001148. http://www.opticsinfobase.org/abstract.cfm?URI=ol-31-8-1148. [DOI] [PubMed]
- 11.Okuno T, Onishi M, Kashiwada T, Ishikawa S, Nishimura M. Silica-based functional fibers with enhanced nonlinearity and their applications. IEEE J Sel Top Quantum Electron. 1999;5:1385. [Google Scholar]
- 12.Tu H, Liang X, Marks DL, Boppart SA. Emergence of self-organized long-period fiber gratings in supercontinuum-generating optical fibers. Opt Lett. 2009;34:668–670. doi: 10.1364/ol.34.000668. http://www.opticsinfobase.org/ol/abstract.cfm?URI=ol-34-5-668. [DOI] [PMC free article] [PubMed]
- 13.Hill KO, Fujii Y, Johnson DC, Kawasaki BS. Photosensitivity in optical fiber waveguides: Application to reflection filter fabrication. Appl Phys Lett. 1978;32:647. [Google Scholar]
- 14.Tauser F, Leitenstorfer A, Zinth W. Amplified femtosecond pulses from an Er:fiber system: Nonlinear pulse shortening and selfreferencing detection of the carrier-envelope phase evolution. Opt Express. 2003;11:594–600. doi: 10.1364/oe.11.000594. http://www.opticsinfobase.org/oe/abstract.cfm?URI=oe-11-6-594. [DOI] [PubMed]
- 15.Hu M, Wang CY, Chai L, Zheltikov A. Frequency-tunable anti-Stokes line emission by eigenmodes of a birefringent microstructure fiber. Opt Express. 2004;12:1932–1937. doi: 10.1364/opex.12.001932. http://www.opticsinfobase.org/oe/abstract.cfm?URI=oe-12-9-1932. [DOI] [PubMed]
- 16.Mitrofanov AV, Linik YM, Buczynski R, Pysz D, Lorenc D, Bugar I, Ivanov AA, Alfimov MV, Fedotov AB, Zheltikov AM. Highly birefringent silicate glass photonic-crystal fiber with polarization-controlled frequency-shifted output: A promising fiber light source for nonlinear Raman microspectroscopy. Opt Express. 2006;14:10645–10651. doi: 10.1364/oe.14.010645. http://www.opticsinfobase.org/abstract.cfm?URI=oe-14-22-10645. [DOI] [PubMed]
- 17.Ivanov AA, Alfimov MV, Zheltikov AM, Szpulak M, Urbanczyk W, Wójcik J. Polarization-controlled vectorial spectral transformations of femtosecond pulses in a birefringent photonic-crystal fiber. J Opt Soc Am B. 2006;23:986–991. http://www.opticsinfobase.org/abstract.cfm?URI=josab-23-5-986.
- 18.Hilligsøe KM, Paulsen HN, Thøgersen J, Keiding SR, Larsen JJ. Initial steps of supercontinuum generation in photonic crystal fibers. J Opt Soc Am B. 2003;20:1887–1893. http://www.opticsinfobase.org/josab/abstract.cfm?URI=josab-20-9-1887.
- 19.Cristiani I, Tediosi R, Tartara L, Degiorgio V. Dispersive wave generation by solitons in microstructured optical fibers. Opt Express. 2004;12:124–135. doi: 10.1364/opex.12.000124. http://www.opticsinfobase.org/oe/abstract.cfm?URI=oe-12-1-124. [DOI] [PubMed]
- 20.Ortigosa-Blanch A, Knight JC, Russell PStJ. Pulse breaking and supercontinuum generation with 200-fs pump pulses in photonic crystal fibers. J Opt Soc Am B. 2002;19:2567–2572. http://www.opticsinfobase.org/josab/abstract.cfm?URI=josab-19-11-2567.
- 21.Herrmann J, Griebner U, Zhavoronkov N, Husakou A, Wadsworth WJ, Knight JC, Russell PStJ, Korn G. Experimental evidence for supercontinuum generation by fission of higher-order solitons in photonic fibers. Phys Rev Lett. 2002;88:173901. doi: 10.1103/PhysRevLett.88.173901. [DOI] [PubMed] [Google Scholar]
- 22.Palero J, Boer V, Vijverberg J, Gerritsen H, Sterenborg HJCM. Short-wavelength two-photon excitation fluorescence microscopy of tryptophan with a photonic crystal fiber based light source. Opt Express. 2005;13:5363–5368. doi: 10.1364/opex.13.005363. http://www.opticsinfobase.org/abstract.cfm?URI=oe-13-14-5363. [DOI] [PubMed] [Google Scholar]
- 23.Kuhlmey BT, McPhedran RC, Martijn de Sterke C. Modal cutoff in microstructured optical fibers. Opt Lett. 2002;27:1684–1686. doi: 10.1364/ol.27.001684. http://www.opticsinfobase.org/abstract.cfm?URI=ol-27-19-1684. [DOI] [PubMed]
- 24.Banaee MG, Young JF. High-order soliton breakup and soliton self-frequency shifts in a microstructured optical fiber. J Opt Soc Am B. 2006;23:1484–1489. [Google Scholar]
- 25.Gorbach AV, Skryabin DV, Stone JM, Knight JC. Four-wave mixing of solitons with radiation and quasi-nondispersive wave packets at the short-wavelength edge of a supercontinuum. Opt Express. 2006;14:9854–9863. doi: 10.1364/oe.14.009854. http://www.opticsinfobase.org/oe/abstract.cfm?URI=oe-14-21-9854. [DOI] [PubMed]
- 26.Gorbach AV, Skryabin DV. Light trapping in gravity-like potentials and expansion of supercontinuum spectra in photonic crystal fibres. Nat Photonics. 2007;1:653–657. [Google Scholar]
- 27.Gorbach AV, Skryabin DV. Theory of radiation trapping by the accelerating solitons in optical fibers. Phys Rev A. 2007;76:053803. [Google Scholar]
- 28.Austin DR, Martijn de Sterke C, Eggleton BJ, Brown TG. Dispersive wave blue-shift in supercontinuum generation. Opt Express. 2006;14:11997–12007. doi: 10.1364/oe.14.011997. http://www.opticsinfobase.org/abstract.cfm?URI=oe-14-25-11997. [DOI] [PubMed]
- 29.Skryabin DV, Luan F, Knight JC, Russell PStJ. Soliton self-frequency shift cancellation in photonic crystal fibers. Science. 2003;301:1705–1708. doi: 10.1126/science.1088516. [DOI] [PubMed] [Google Scholar]
- 30.Genty G, Lehtonen M, Ludvigsen H, Broeng J, Kaivola M. Spectral broadening of femtosecond pulses into continuum radiation in microstructured fibers. Opt Express. 2002;10:1083–1098. doi: 10.1364/oe.10.001083. http://www.opticsinfobase.org/oe/abstract.cfm?URI=oe-10-20-1083. [DOI] [PubMed]
- 31.Genty G, Lehtonen M, Ludvigsen H, Kaivola M. Enhanced bandwidth of supercontinuum generated in microstructured fibers. Opt Express. 2004;12:3471–3480. doi: 10.1364/opex.12.003471. http://www.opticsinfobase.org/oe/abstract.cfm?URI=oe-12-15-3471. [DOI] [PubMed]
- 32.White TP, Kuhlmey BT, McPhedran RC, Maystre D, Renversez G, de Sterke CM, Botten LC. Multipole method for microstructured optical fibers. I. Formulation. J Opt Soc Am B. 2002;19:2322–2330. http://www.opticsinfobase.org/abstract.cfm?URI=josab-19-10-2322.
- 33.Genty G, Lehtonen M, Ludvigsen H. Effect of cross-phase modulation on supercontinuum generated in microstructured fibers with sub-30 fs pulses. Opt Express. 2004;12:4614–4624. doi: 10.1364/opex.12.004614. http://www.opticsinfobase.org/oe/abstract.cfm?URI=oe-12-19-4614. [DOI] [PubMed]
- 34.Chen CL. Foundations for guide-wave optics. Wiley-interscience; Hoboken, New Jersey: 2007. [Google Scholar]
- 35.Nishizawa N, Goto T. Pulse trapping by ultrashort soliton pulses in optical fibers across zero-dispersion wavelength. Opt Lett. 2002;27:152–154. doi: 10.1364/ol.27.000152. [DOI] [PubMed] [Google Scholar]
- 36.Stone JM, Knight JC. Visibly “white” light generation in uniform photonic crystal fiber using a microchip laser. Opt Express. 2008;16:2670–2675. doi: 10.1364/oe.16.002670. http://www.opticsinfobase.org/abstract.cfm?URI=oe-16-4-2670. [DOI] [PubMed]
- 37.Dudley J, Gu X, Xu L, Kimmel M, Zeek E, O’Shea P, Trebino R, Coen S, Windeler R. Cross-correlation frequency resolved optical gating analysis of broadband continuum generation in photonic crystal fiber: simulations and experiments. Opt Express. 2002;10:1215–1221. doi: 10.1364/oe.10.001215. http://www.opticsinfobase.org/oe/abstract.cfm?URI=oe-10-21-1215. [DOI] [PubMed]


