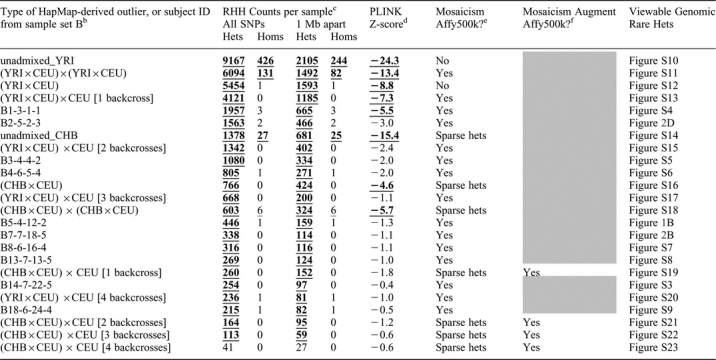
Table 3.
Extreme “tail” of RHH count distribution containing outliers from sample set B, HapMap, and simulated matings of HapMap individualsa
 |
aRHH analysis of simulated HapMap ethnic outliers combined with sample set B; subjects are sorted from highest to lowest rare-het counts under “All SNPs” (column 2) with some set B subjects omitted to show all HapMap-derived outliers. “CEU”, “CHB”, “YRI” denote HapMap subjects of Caucasian, Chinese, and African Yoruban ancestry respectively.
bEach “unadmixed” outlier is a HapMap YRI or CHB subject; other HapMap-derived outliers are progeny of simulated matings denoted by “×”; for example, “(YRI×CEU)×CEU [2 backcrosses]” denotes offspring from mating of a HapMap YRI and CEU subject followed by mating (“backcross”) in next two generations with a CEU subject; set B subjects have same ID used in Table 1
cUnthinned counts under “All SNPs” and thinned counts under “1 Mb apart” are from 401,430 HapMap SNPs genotyped on Affy500K and having resolvable strand for HapMap versus Affy. Counts exceeding permutation-derived threshold are bold and underlined (signifying p<0.001) or only underlined (signifying p<0.05).
dLowest PLINK Z-score from 1st thorough 10th nearest-neighbor distributions. Z-scores are bold and underlined if statistically significant (Z<−4.0).
eMosaicism using Affy500K chip: “Yes” if rare-het mosaicism is visually obvious; “No” if dense rare hets cover entire genome; “Sparse hets” if rare het density is too sparse to clearly discern mosaicism (as in simulated subjects of CHB ancestry).
f“Yes” if subject shows obvious rare-het mosaicism when Affy500K chip is augmented with ∼40,400 HapMap SNPs monomorphic in HapMap CEU but with minor allele frequency above 0.1 in CHB.
