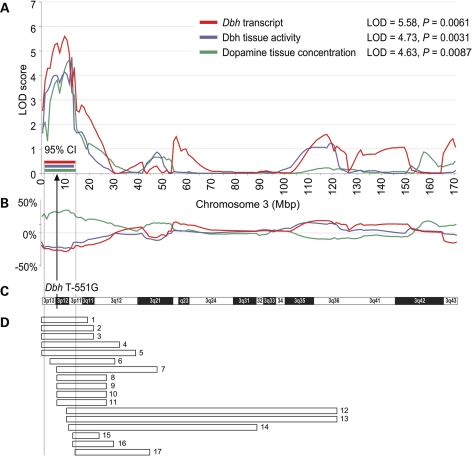
Figure 2.
Co-localization of physiological and expression QTLs on the short arm of chromosome 3. (A) LOD plots for dopamine tissue concentration, Dbh tissue enzymatic activity and Dbh gene expression are shown. Peak LOD values are given in the inset. 95% confidence intervals (95% CIs), determined by 2-LOD drop, are shown beneath the peaks. (B) Additive/directional effect of the SHR allele on each trait at different RNO 3 loci is expressed as percent deviation from the overall trait mean. The arrow marks the location of the Dbh promoter SNP T − 551G. (C) Chromosome 3 idiogram is provided for reference. (D) Analysis of previously mapped cardiovascular QTLs overlapping with the conflated 95% CIs for the three QTLs reported here. Each bar represents a previously localized physiological QTL (data from http://rgd.mcw.edu). Bar numbers refer to Supplementary Material, Table S2 online, where details for each QTL can be found.

