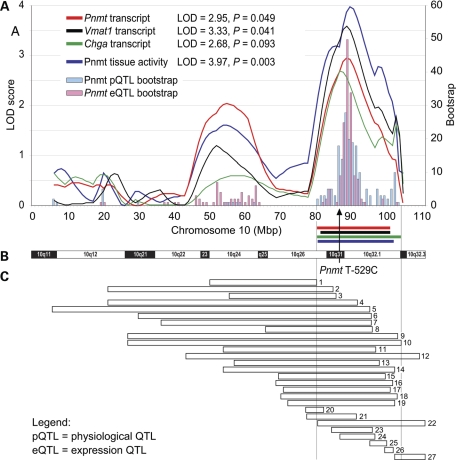
Figure 3.
Co-localization of physiological and expression QTLs on chromosome 10. (A) LOD plots for adrenal Pnmt tissue enzymatic activity and Pnmt, Vmat1 and Chga transcript abundance. Peak LOD values are given in the inset. Bootstrap test was used to estimate the 95% confidence intervals (95% CIs) for Pnmt tissue activity and Pnmt transcript abundance—see Materials and Methods for details. Horizontal bars represent 2-LOD drop CIs; different traits are colored same as the LOD plots. SHR allele at the peak locus was associated with a trait value decrease for all four traits. The arrow points to the location of the Pnmt promoter SNP T − 529G. (B) Idiogram of rat chromosome 10 is provided for reference. (C) Analysis of previously mapped cardiovascular QTLs overlapping with the conflated 95% CI for the QTLs reported here. Each bar represents a physiological QTL (data from http://rgd.mcw.edu). Bar numbers refer to Supplementary Material, Table S3 online, where details can be found.

