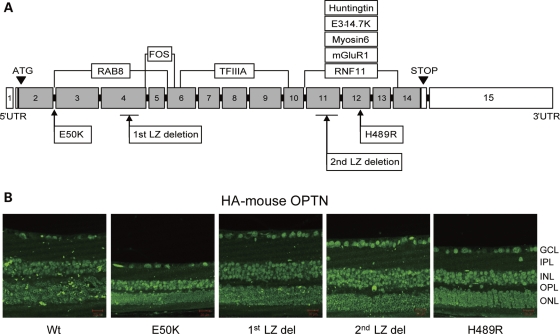
Figure 1.
(A) Schematic diagram of the mouse Optn constructs used in this study. Positions of mutations and deletions are shown in lower boxes. Predicted binding sites of Optn-interacting proteins are shown in upper boxes. (B) Expression of Optn mutants in the retina of transgenic mice. Sections were immunostained with anti-HA antibody. Scale bar: 20 μm.

