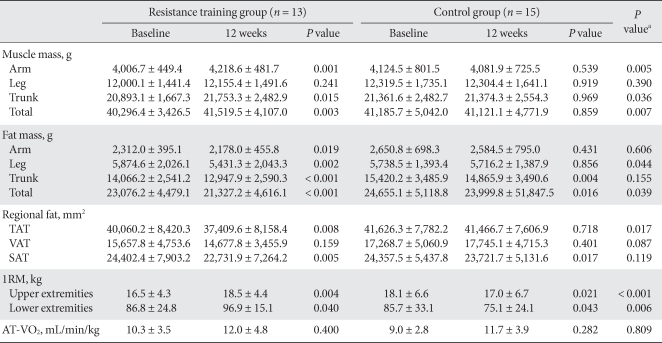
Table 3.
Changes in muscle mass, fat mass, regional fat, muscle strength, and aerobic capacity
The values were presented as mean ± standard deviation.
TAT, total adipose tissue; VAT, visceral adipose tissue; SAT, subcutaneous adipose tissue; 1RM, one repetition maximum; AT-VO2, uptake oxygen at anaerobic threshold.
aP values for comparisons between resistance training group and control group.

