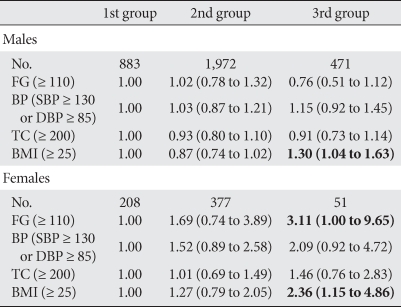
Table 6.
Relative risk for the high level of blood pressure, glucose, total cholesterol and being obese in adulthood across the level of physical fitness during adolescence
Data presented as the relative risk (95% confidence interval).
1st group, most fit; 3rd group, least fit.
FG, fasting glucose; BP, blood pressure; SBP, systolic blood pressure; DBP, diastolic blood pressure; TC, total cholesterol; BMI, body mass index.

