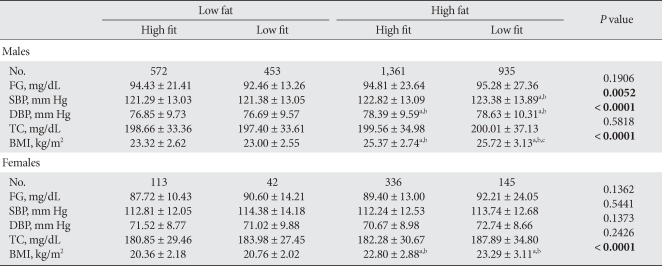
Table 7.
Metabolic parameters in adulthood across the level of mixed physical fitness and body index during adolescence
Data presented as the mean ± standard deviation.
FG, fasting glucose; SBP, systolic blood pressure; DBP, diastolic blood pressure; TC, total cholesterol; BMI, body mass index.
aSignificantly different from low fat and high fit, bSignificantly different from low fat and low fit, cSignificantly different from high fat and high fit.

