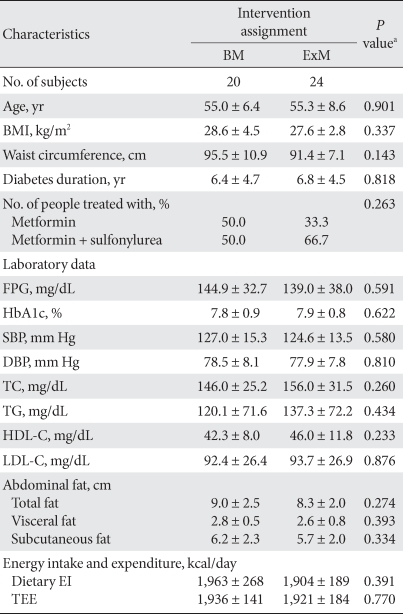
Table 1.
Baseline characteristics of the BM and ExM group
The values were presented as mean ± standard deviation.
BM, small rice bowl-based meal plan; ExM, food exchange-based meal plan; BMI, body mass index; FPG, fasting plasma glucose; HbA1c, glycosylated hemoglobin; SBP, systolic blood pressure; DBP, diastolic blood pressure; TC, total cholesterol; TG, triglycerides; HDL-C, high density lipoprotein cholesterol; LDL-C, low density lipoprotein cholesterol; EI, energy intake; TEE, total energy expenditure.
aThe P values are for comparison between BM and ExM by independent t-test.

