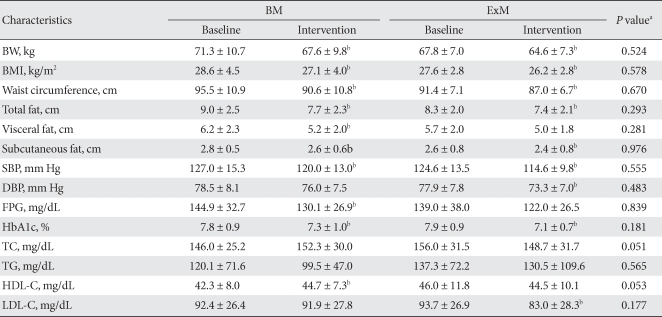
Table 3.
Change in body weight, abdominal fat, glycemic control and plasma lipids
The values were presented as mean ± standard deviation.
BM, small rice bowl-based meal plan; ExM, food exchange-based meal plan; BW, body weight; BMI, body mass index, SBP, systolic blood pressure; DBP, diastolic blood pressure; FPG, fasting plasma glucose; HbA1c, glycosylated hemoglobin; TC, total cholesterol; TG, triglycerides; HDL-C, high density lipoprotein cholesterol; LDL-C, low density lipoprotein cholesterol.
aThe P-values are for comparison for the change from baseline to intervention between BM and ExM by independent t-test, bThe P values < 0.05 are for comparison between baseline and intervention by paired t-test.

