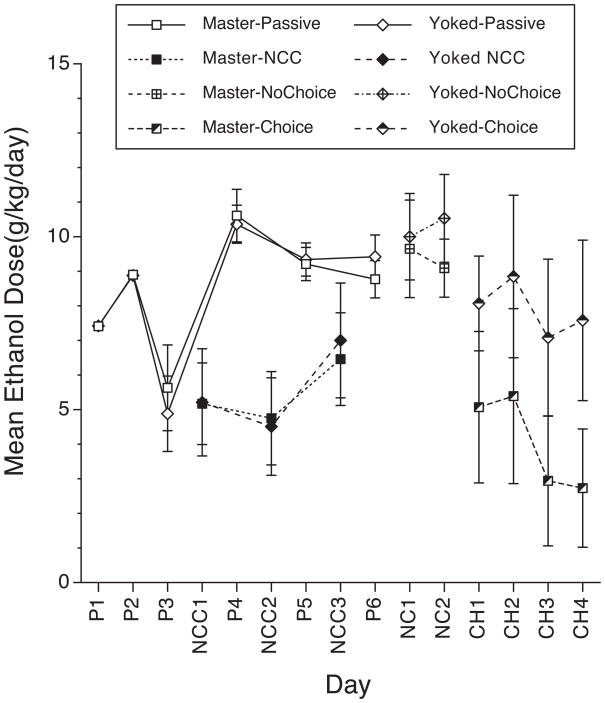
Figure 3.
Mean (± SEM) ethanol dose (g/kg/day) for rats in the Master (n=7, squares) and Yoked (n=6, diamonds) Groups in Experiment 3 during the passive infusion (P1–P6, open symbols), no-choice control (NCC1-3, closed symbols), no-choice (NC1-2, hatched symbols), and choice (CH1-4, top filled symbols). Groups differed only in their treatment during the no-choice control days during which Masters controlled the ethanol dose for themselves and the Yoked rats. For the Masters, these were regular no-choice days with one fluid available and licks on this fluid produced infusions of 20% ethanol on an FR10 schedule. Each rat in the Yoked group received the same infusions as a rat in the Master group but the infusions were non-contingent. During No-Choice days, rats in both groups had access to a Kool-Aid solution and licks were paired with infusions of 20% ethanol. On choice days, a second Kool-Aid solution was also available. Licks on the second solution were paired with infusions of water on an FR10 schedule.

