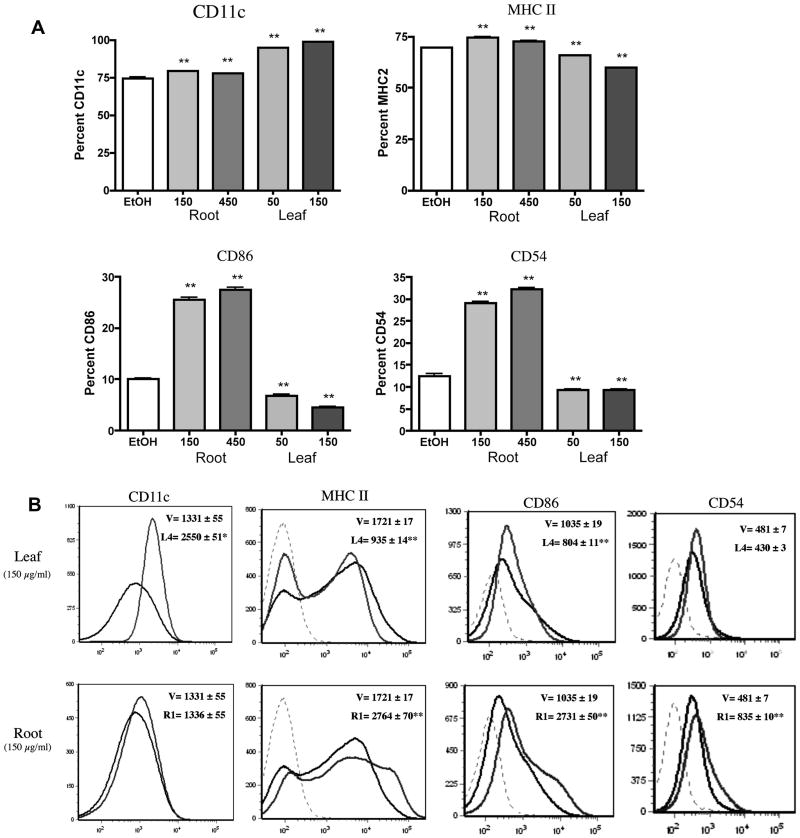
Figure 1.
BMDC expression of accessory molecules is differentially affected by E. purpurea leaf and root extracts. Flt3-ligand-derived BMDCs (106) were treated with extracts or the ethanol (0.5%) controls for 48 h at the designated concentrations. The percentage positive (A) and Mean Channel Fluorescence (B) profiles were determined by FACS analysis. Results are shown as mean ± SEM (n=6) and are representative of two separate experiments. (B) Histograms represent BMDCs treated with the ethanol vehicle (black line) or E. purpurea leaf extracts (gray). Dashed lines indicate isotype controls. L4 corresponds to our leaf extract while R1 corresponds to our root extract. *p<0.05 and **p<0.01 compared to control.

