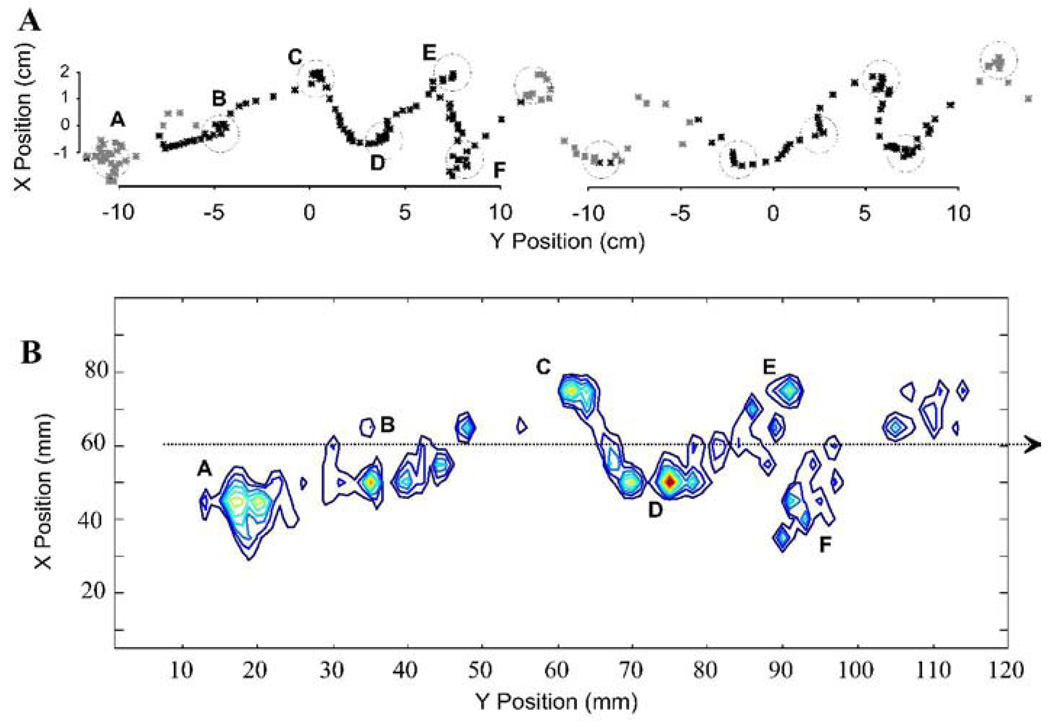
Figure 11.
WS ST rats. Cartesian path of Center of Pressure. A: the X Y plane (horizontal plane viewed from above) position of the center of pressure is plotted as the SCI rat traverses the runway. Black asterisks show positions in which the rat was wholly on a sensor. Grey asterisks indicate transition onto, between or off force sensors. Circles show dwell points of center of pressure in which many tens of points are overlaid. Note clearly zig-zag pattern of center of pressure indicated by circles. B: contour plot of a segment of data in A subjected to smoothing with gaussian radial basis functions. Dwell points more spatially spread than in the normal rats. The dwell points are arrayed on either side of a nearly straight line of progression (schematically indicated by the dotted arrow). These represent virtual points of contact of a single virtual leg. Their imprecision and lateral placement reflects the lower precision and control of locomotion in these rats and the energy which must be put into lateral as opposed to forward motions.

