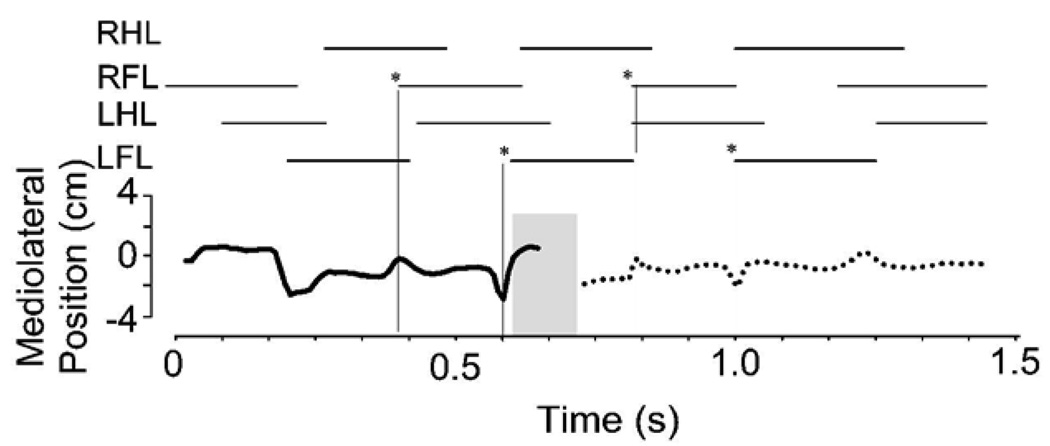
Figure 5.
Normal rat. Center of Pressure motion: lateral deviations over time. The calculated mediolateral deviations of the center of pressure are plotted through time. The deviations are lateral, and the line of travel was down the long axis of the runway. If there were no deviations the plot would be a straight line at 0 through time. Stance phases are plotted above. Solid line : on sensor 1. Dotted line: on sensor 2. Shaded area is Phase II in which CoP calculation was not trustworthy. * and vertical hairlines indicate onset of forelimb stance: deviations in CoP peak around these transitions.

