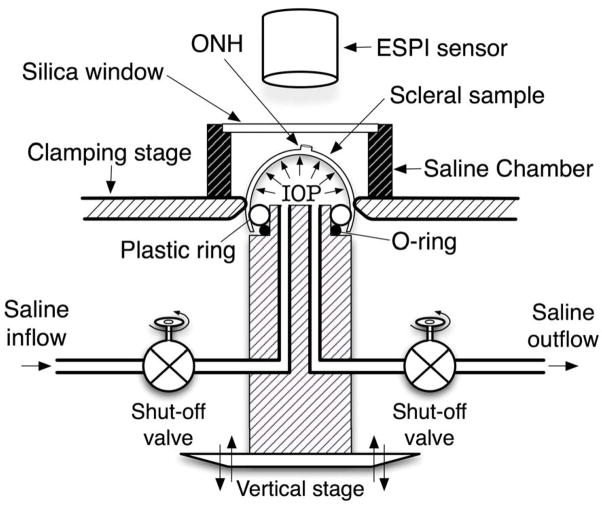
Figure 1.
Schematic of the scleral shell pressurization apparatus. The posterior scleral shell was first mounted onto the plastic ring, and then clamped slightly above the equator by moving the vertical stage toward the clamping stage. Saline outflow was interrupted after saline filled the posterior shell cavity and IOP reached 5 mmHg. The scleral surface was imaged with an electronic speckle pattern interferometry (ESPI) sensor as IOP increased from 5 to 45 mmHg in 0.2 mmHg increments.

