
Figure 2.
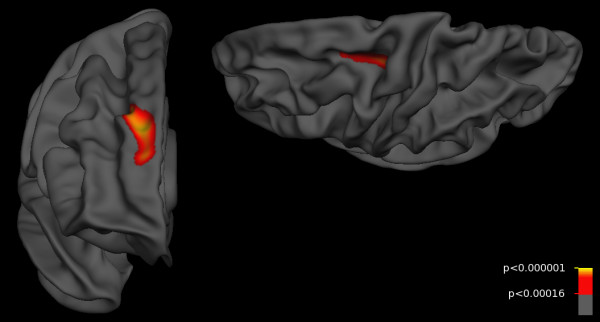
Cortical thickness differences between controls and alcohol-using amphetamine dependent subjects. Controls showed thicker cortex than patients with more than one year of heavy alcohol use (A≥1 vs control) in superior-frontal regions, covering more areas in the right than left hemisphere. Views are rostral right hemisphere and dorsal left hemisphere. Colored regions indicate p-values less than 0.00016, a threshold for which the expected number of false positives is under 5%. Colors are coded by (-log10), with red indicating p = 0.00016 and yellow indicating p < 0.000001.