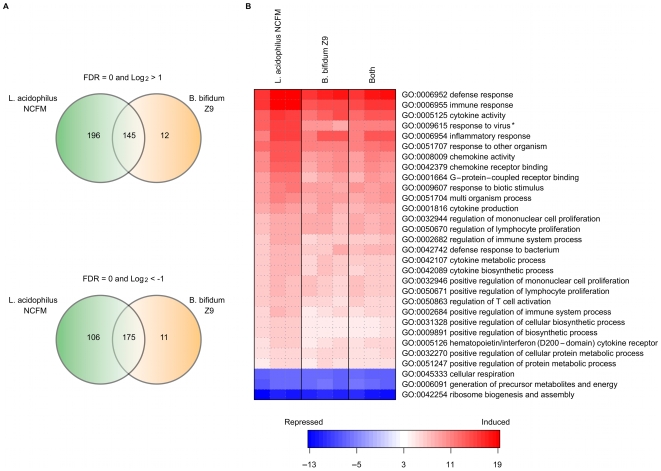
Figure 2. Microarray analysis of dendritic cells stimulated with Lactobacillus acidophilus NCFM and Bifidobacterium bifidum Z9.
Up- and downregulation of genes upon incubation of dendritic cells with L. acidophilus NCFM and B. bifidum Z9, respectively, and both strains in combination. A. Venn diagram depicting the distinct up- and down regulation and overlap of genes. Only genes with an absolute fold change greater than 2 were included. B. Parametric Gene Set Enrichment of Gene Ontology (GO) Biological Process terms of the top 30 most significant GO terms comparing L. acidophilus NCFM vs. control (no stimulation). Blue indicates repression of the genes, white indicates no change and red indicates induction of the genes in the GO term. Only the GO term “response to virus” was significantly different (*) when comparing L. acidophilus NCFM and B. bifidum Z9 responses.

