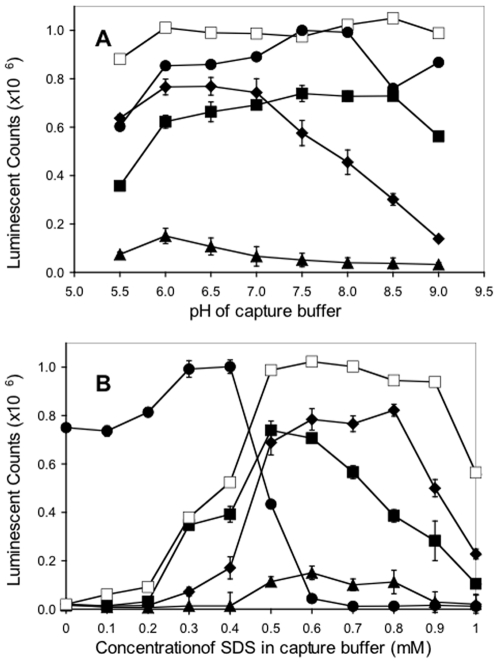
Figure 4. Effects of SDS concentration and pH on BoNT/B capture.
Plates were coated with the capture antibody: F24-1 ♦; F26-16 ■; F27-33 ▲; F29-40 □; MCS6-27 ●. A. pH of capture buffer (1×TBS) was adjusted for each capture antibody at concentrations of SDS as follows; F24-1, 0.7 mM; F26-16, 0.5 mM; F27-33, 0.6 mM; F29-40, 0.6 mM; MCS6-27, 0.3 mM. B. Concentration of SDS in capture buffer was adjusted for each capture antibody at the following pH; F24-1, pH 6.0; F26-16, pH 7.5; F27-33, pH 6.0; F29-40, pH 8.0; MCS6-27, pH 8.0. Data are presented as average of 3 samples ±1 standard error.

