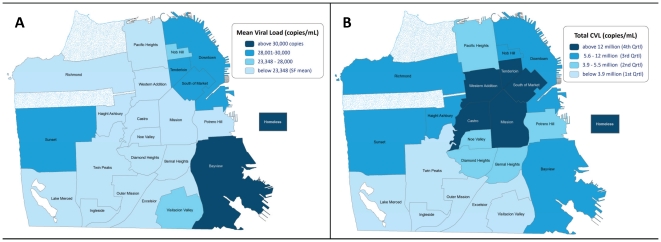
Figure 1. Spatial Distribution of CVL by Neighborhood, 2005–2008.
Neighborhood mean (1a) and total CVL (1b) are shown. Mean CVL was highest among homeless individuals (38,974copies/mL; N = 775; 6%). The highest mean CVL (38,428 copies/mL; N = 278; 2%) was in the southeast neighborhood of Bayview, which is characterized by lower income and a predominantly African-American population. The northeast and inner city areas of the Tenderloin and South of Market (characterized by low income and large numbers of IDU, commercial sex workers, and transgendered persons) also had a mean CVL above the municipal average (28,093 copies/mL; N = 1,486; 12%). The Castro neighborhood (an historic gay and relatively upper-income neighborhood with very high HIV/AIDS case density) had a mean CVL of 21,352 copies/mL (N = 2,106; 17%), below the city as a whole. The distinction between mean CVL and total CVL is seen in 1b. The highest total CVLs are evident in the Tenderloin, South of Market, Mission, and the Castro, where there are either large numbers of persons living with HIV, many persons with high VLs, or a combination thereof.

