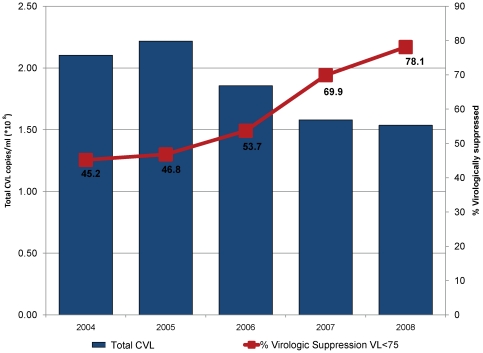
Figure 2. Total CVL and Virologic Suppression, 2004–2008.
There was a statistically significant decline in annual measures of total CVL from 2004–2008 (p = 0.021). As expected, there was an inverse correlation between the increase in virologic suppression (red line) from 45% in 2004 to 78% in 2008 (p = 0.006) and total CVL (p = 0.011).

