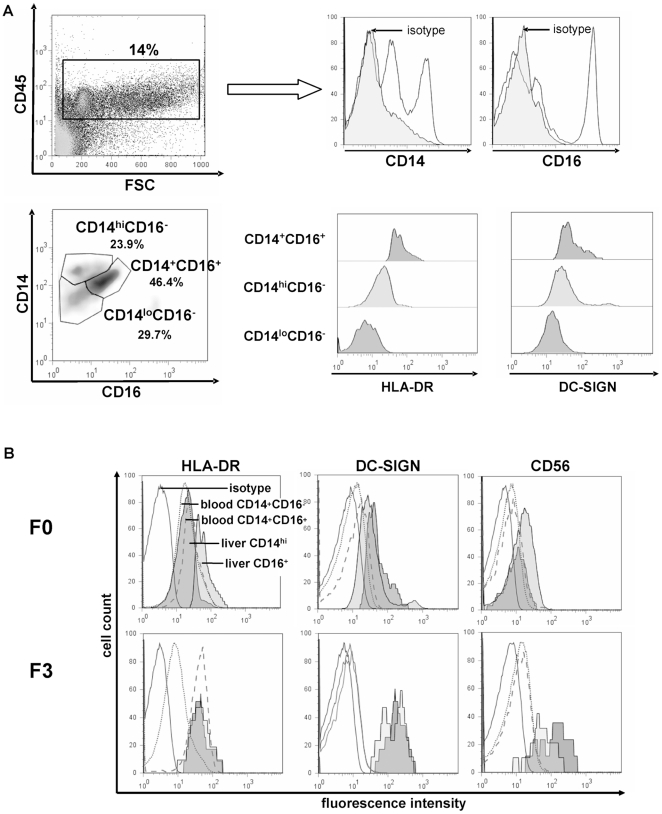
Figure 4. Intrahepatic macrophages consist of different subpopulations mirroring blood monocyte subsets.
(A) FACS analysis of intrahepatic monocytes/macrophages, based on >30 fresh liver biopsies. Representative plots are displayed. Among the CD45+ intrahepatic leukocytes, three different populations of intrahepatic CD14+ macrophages can be distinguished based on CD14 and CD16 expression that also differ characteristically in HLA-DR and DC-SIGN expression. (B) Expression levels of monocyte/macrophage activation and differentiation markers were compared in the same patients between blood CD14+CD16− monocytes (dotted line) and liver CD14hiCD16− macrophages (dark grey) as well as CD14+CD16+ monocytes (dashed line) and liver CD14+CD16+ macrophages (light grey); representative analyses from patients with a F0 fibrosis (no fibrosis, upper panel) and a F3 fibrosis (advanced fibrosis, lower panel) are shown. Isotype control, black line. Blood was drawn at the time of liver biopsy, and blood/liver samples were run with the same FACS settings at the same time.

