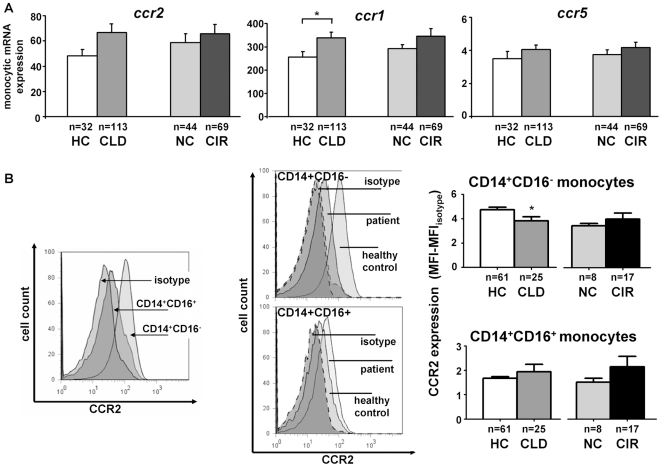
Figure 6. Regulation of chemokine receptors on circulating monocytes in chronic liver disease.
(A) Monocytic chemokine receptor gene expression by real-time PCR after purification of circulating monocytes by CD14 microbeads (MACS). (B) CCR2 expression (MFI, mean fluorescence intensity) on blood monocyte subsets by FACS. Abbreviations are: HC, healthy control; CLD, chronic liver disease; NC, no cirrhosis; CIR, cirrhosis. Representative histograms are shown, comparing either CCR2 expression levels between both monocyte subsets as well as between healthy controls and CLD patients on the two monocyte subpopulations in peripheral blood. *p<0.05, **p<0.001.

