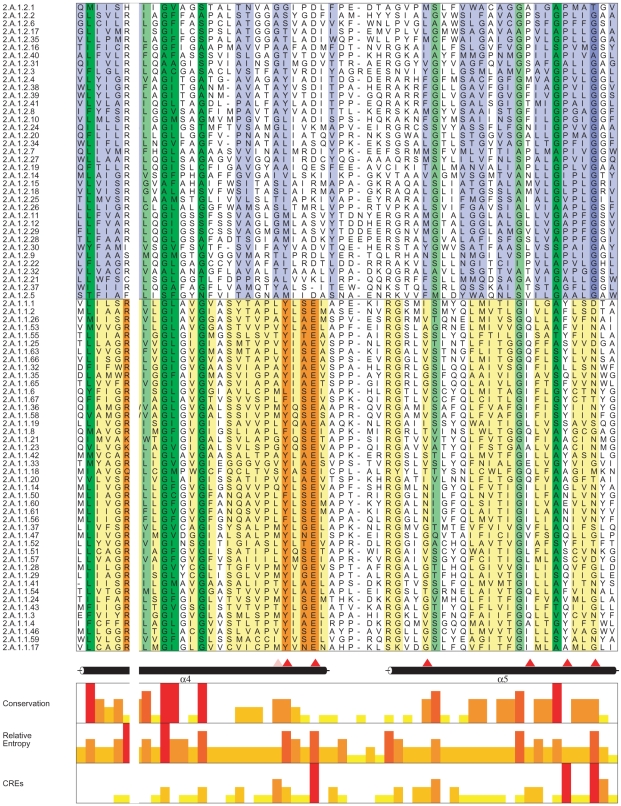
Figure 1. Representative alignment of MFS sequences.
Figure showing a representative portion of the Multiple Sequence Alignment of the MFS sequences and is generated using Alscript [31]. The top 37 sequences which are boxed belong to the DHA1 family and the next 44 belong to the SP family. The part of the MSA spanning helix 4 and 5 is highlighted in the figure. Alignment columns are coloured in a gradient based on the degree of conservation. TCDB ID of CaMdr1p Sequence is 2.A.1.2.6 and is third from the top. The complete MSA is shown in Supplementary Data DS1. Green columns denote family-wide conservation, while conserved columns in DHA1 and SP family are coloured in blue and yellow respectively. A comparison of conservation, RE and CRES scores are shown as histograms [28]. CRES identifies columns which are differentially conserved in the DHA1 family. The phenotypes of the mutated positions in CaMdr1p are indicated by triangles, red being sensitive and pink being differential.

