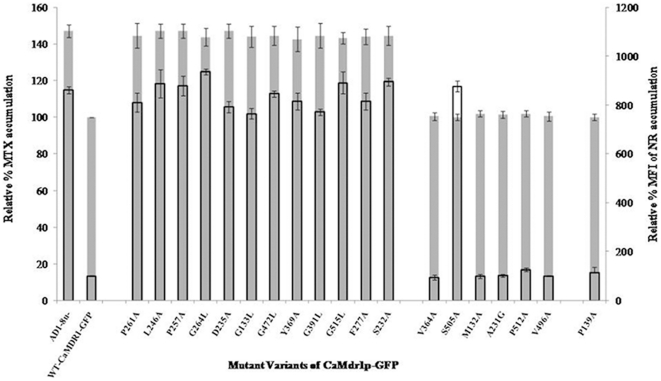
Figure 5. [3H] MTX and NR accumulation in the mutant variants of CaMdr1p-GFP.
The graph shows accumulation levels of these substrates relative to WT-CaMDR1-GFP. The grey colored bars (no border) indicate levels of accumulation for [3H] MTX while empty bars (black border) indicate that for NR. Controls AD1-8u- and CaMdr1p-GFP have also been included for comparison. The accumulation assays with [3H] FLU gave similar results as [3H] MTX for all the mutant variants (data not shown). The results are means ± standard deviations for three independent experiments.

