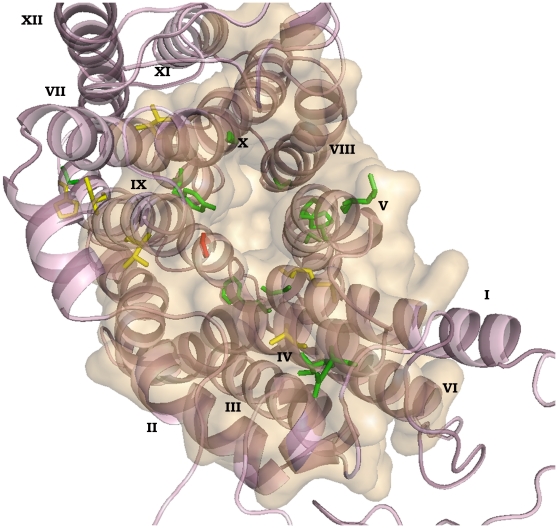
Figure 6. The homology model of CaMdr1p highlighting the 3D location of the mutated residue positions.
The 3D homology model of CaMdr1p wherein the mutated positions are marked onto the model and are coloured on the basis of the phenotypes exhibited upon mutation. Green denotes sensitive, red shows resistant while yellow marks those which exhibit differential sensitivity towards drugs upon mutation. The twelve transmembrane segments (TMS) of CaMdr1p are numbered and are shown as α-helices. The pore is highlighted which clearly exhibits that the mutated positions lie in or around the pore. The structure is viewed using pymol v0.99 (http://www.pymol.org).

