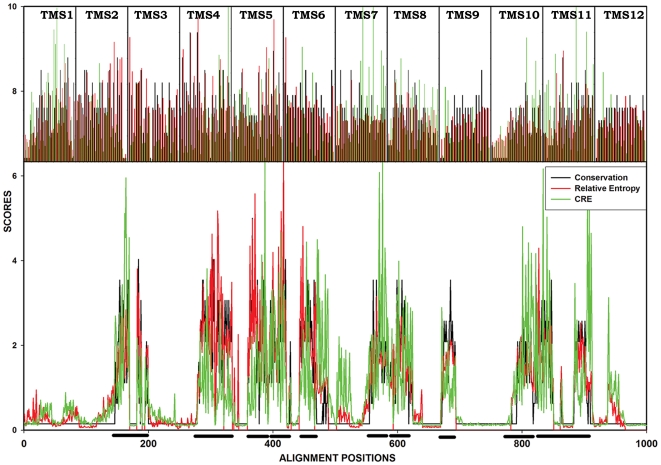
Figure 7. Comparative plot of Conservation, RENULL and CRES across the entire alignment.
The three scores: Conservation in DHA1 family (black), RENULL across DHA1 family (red) and CRES (green) are drawn as a line graph for all the alignment positions in the bottom panel of the Figure. Locations of the TMS are marked by black bars on the x-axis. These twelve TMS are shown separately as an inset in the top panel so to highlight the effectiveness of CRES over RE and traditional conservation. The conservation scores remain almost constant throughout the TMS while RENULL is more prominent in the N-terminal half of the protein. High CRES positions span all the TMS, thus showing the functionally relevant residues to be scattered over both the halves of the protein.

