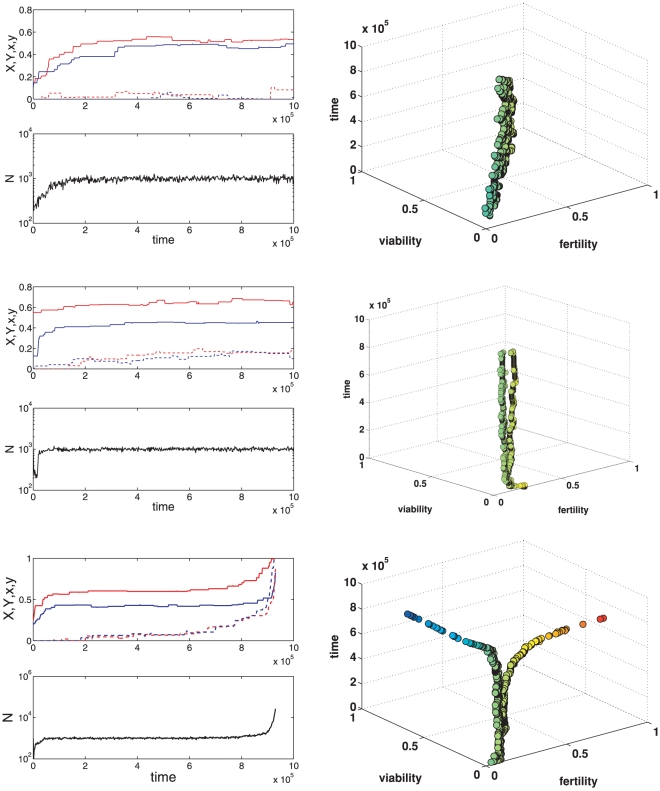
Figure 2. Examples of the model dynamics with  .
.
First column: the dynamics of the main (solid lines) and modifier (dashed lines) allelic effects and the population size. Second column: fertility and viability for pro-some and proto-germ cells; each cell in the population is represented by a circle. Data are saved every 2000 generations. First row:  . Second row:
  . Third row:
  .
.

