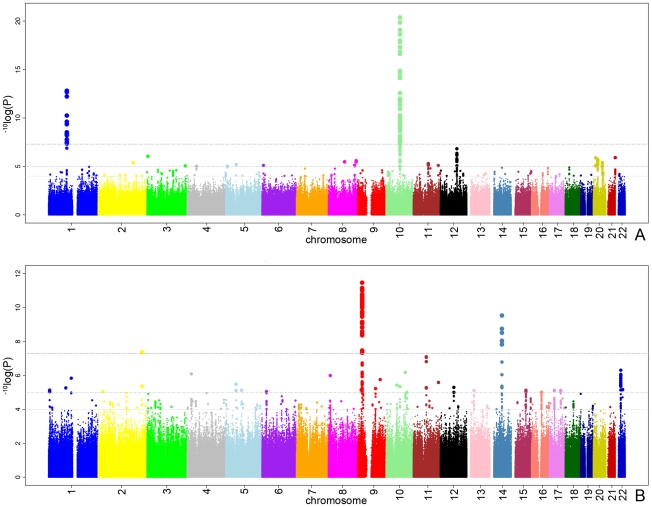
Figure 1. The −10log p-plots for the meta-analyzed RS-I/RS-II genome-wide association study.
Plot (A) of disc area and plot (B) of vertical cup-disc ratio. The upper line represents the genome-wide significance threshold: p = 5×10⁻⁸. The middle and bottom line represents the 10−5 and 10−4 respectively.

