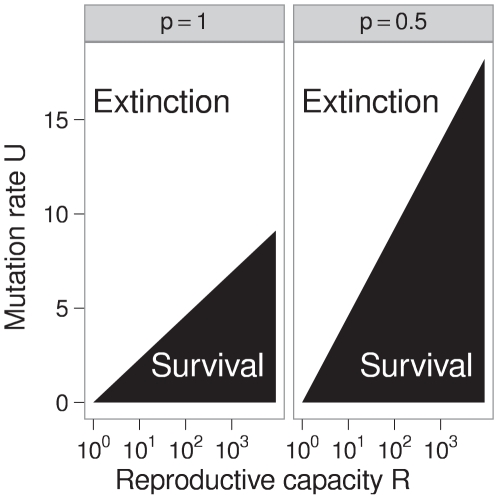
Figure 1. Effect of robustness on virus population survival.
The set of mutation rates and reproductive capacities that allow the virus population to survive according to Equation (3) are shaded. This set is smaller in the absence of mutational robustness ( ) than in the presence of considerable robustness (
 ), but the relationship between
  and
and  is consistently log-linear.

