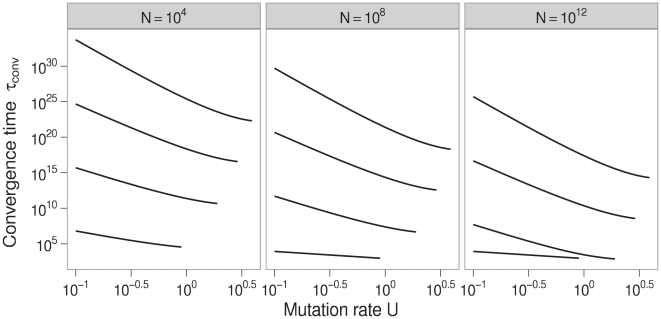
Figure 2. Expected time to evolve maximum robustness.
In the neutral-staircase fitness landscape, the maximum neutrality increases as the number of active blocks increases. The expected time, in generations, for the number of active blocks  to go from one to a maximum number
  of 20 is plotted using Equation (8). The curves in each panel, from lowest to highest, correspond to the number of between-block bits
  being 2, 4, 6, and 8. The curves for the lowest barrier can be fairly flat because fixation probabilities become the rate-limiting factors. Parameters: number of bitpairs per block
  , reproductive capacity
  .
.

