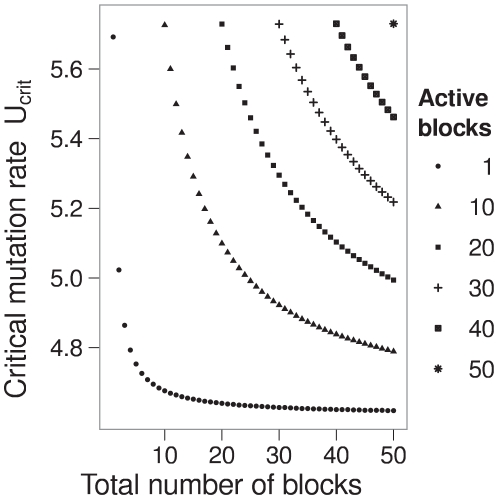
Figure 3. Critical mutation rates in the neutral-staircase fitness landscape.
Critical mutations rates derived from Equation (5) are plotted as a function of the total number of blocks  for varying numbers of active blocks
  . The critical mutation rates increase slowly as the number of active blocks increases. Parameters: number of bitpairs per block
  , reproductive capacity
  , between-block bitstring length
  .
.

