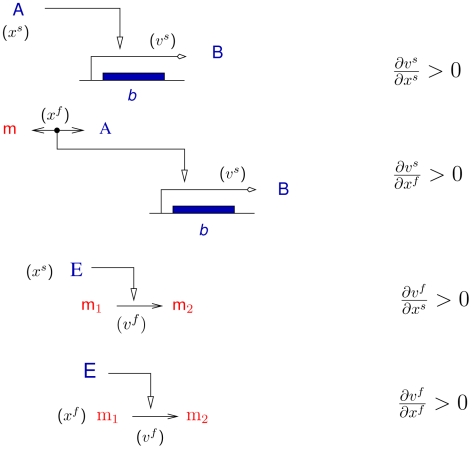
Figure 1. Schematic representation of the partial derivatives of the rates vectors  and
and  , appearing in Eqs. 6 and 8.
An example is provided for each of the four partial derivatives, and its corresponding sign is indicated on the right side. A and B are proteins, E an enzyme, and m, m1, and m2 metabolites.

