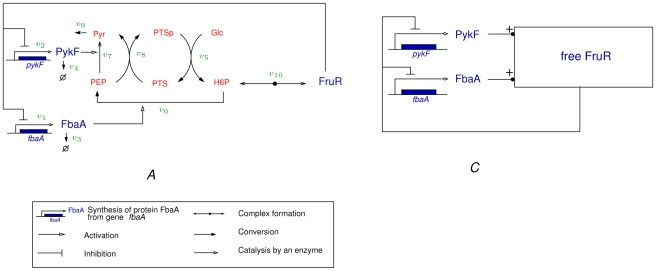
Figure 3. Simplified glycolysis model, adapted from [30], including the genetic regulation of enzyme expression by FruR.
A: Network of biochemical reactions. The conversion of a generic hexose-6-phosphate H6P to PEP is schematized as a single reaction, with FbaA being assumed representative of all glycolytic enzymes. The network also includes a simplified description of the PTS, including the phosphorylated and non-phosphorylated form of its enzymes (represented by PTSp and PTS, respectively). The total concentration of the PTS enzymes is assumed constant. FruR is inactivated when bound to fructose-6-phosphate, here represented by H6P. The total (bound and unbound) FruR concentration is assumed constant in this example. The reactions correspond to protein synthesis ( ), protein degradation (
 ), enzymatic reactions (
 ), and complex formation (
 ). Proteins are shown in red, metabolites in blue, and reactions in green. B: Kinetic model of the network in the form of Eq. 3 and 4, separating the slow (protein synthesis and degradation) from the fast processes (enzymatic reactions and complex formation). The corresponding slow variables are the total enzyme concentrations (
 ), while the fast variables are the metabolite concentrations (
 ), the concentration of FruR protein in its free form (
 ), and the phosphorylated PTS enzyme (
 ). C: Complete network of direct and indirect gene regulatory interactions, with unequivocal signs for the influences of the enzymes on the concentration of free FruR. The interactions are derived from the Jacobian matrix of the slow system (for the detailed analysis of the network, see Text S2).

