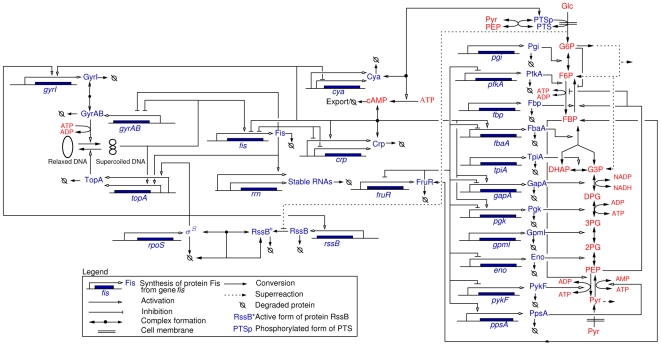
Figure 4. Network of key genes, proteins, and regulatory interactions involved in the carbon assimilation network in E. coli.
The graphical conventions [52] are explained in the legend. The metabolic part includes the glycolysis/gluconeogenesis pathways as well as a simplified description of the PTS system (adapted from [30]), via the phosphorylated and non-phosphorylated form of its enzymes (represented by PTSp and PTS, respectively). The pentose-phosphate pathway (PPP) is not explicitly described but we take into account that a small pool of G6P escapes the upper part of glycolysis. Graphically, the PPP is represented as a ‘super-reaction’, in which elementary steps are lumped together. At the level of the global regulators the network includes the control of the DNA supercoiling level, the accumulation of the sigma factor RpoS and the Crp cAMP complex, and the regulatory role exerted by the fructose repressor FruR. A complete description of the model can be found in Sec. 1 of Text S3. Proteins are shown in red, and metabolites in blue.

