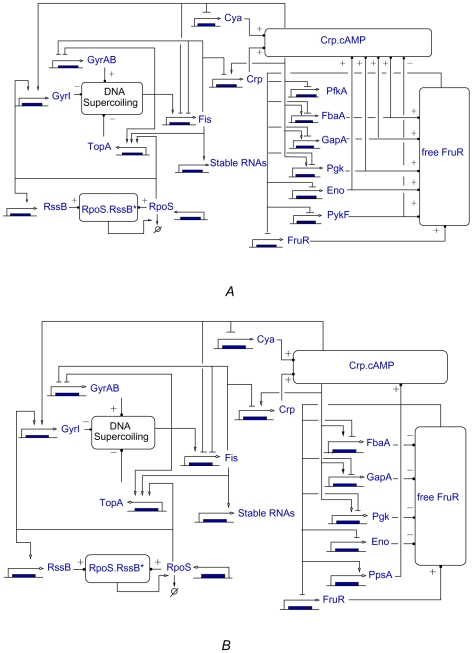
Figure 5. Networks of direct and indirect regulatory interactions in the case of (A) glycolysis and (B) gluconeogenesis.
The networks are computed from the models  and
and  , taking into account allosteric effects (see Sec. 3 of Text S3). The boxes represent fast coupling species, mediating the influence of metabolism and signal transduction on gene expression: Crp
 cAMP, free FruR, RpoS
 RssB*, and DNA supercoiling. The influence of the enzymes and other slow species on the concentration of the fast coupling species are represented by +/− signs.

