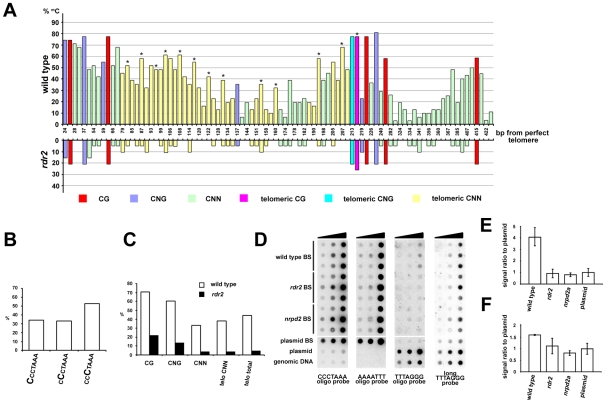
Figure 6. Methylation of telomeric DNA in wild-type and RdDM-deficient plants.
(A) The chart shows the frequency and distribution of cytosine methylation in the 1L-0' region. In total, 30 clones from five independently treated wild-type samples and 19 clones from three independent rdr2 samples were analyzed. Asterisks indicate the third cytosine in the CCCTAAA sequence. (B) The proportion of methylated cytosines in the 1L-0' region of wild-type plants depending on the position within the telomeric repeat as determined by bisulfite sequencing. (C) Frequency of cytosine methylation in the whole 1L-0' region according to sequence context in wild-type and rdr2 plants. (D) Cytosine methylation in bulk telomeric DNA assayed by dot-blot hybridization. Bisulfite-treated (BS) genomic DNA was spotted onto a membrane (∼7, 33 and 200 ng from each sample) and sequentially hybridized with AAAATTT, TTTAGGG and CCCTAAA probes. Untreated wild-type genomic DNA, and untreated and bisulfite-treated (BS) plasmids carrying ∼750 nt of Arabidopsis telomeric DNA were used as controls. (E,F) Quantification of signals obtained with oligo (E) and long (F) TTTAGGG probes. The signal intensity of non-converted DNA (obtained with the TTTAGGG probe) was normalized to the amount of telomeric DNA determined from hybridization with the CCCTAAA probe. The signal from BS-treated plasmid served to determine background hybridization of the probes to fully converted non-methylated telomeric DNA. Error bars represent standard deviation (N = 3).

