
Fig. 2.
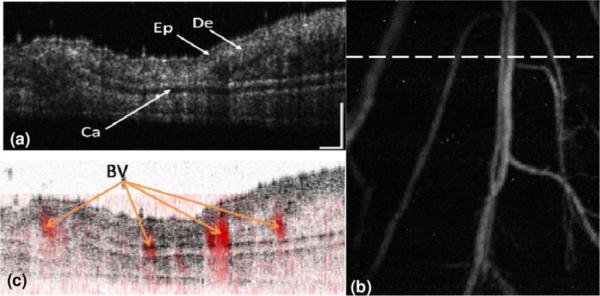
(Color online) Simultaneously acquired OCT and PAM images of a mouse ear. (a) OCT B-scan at the location marked in panel (b) by the dashed line (displayed dynamic range, 45 dB); (b) PAM image (average contrast-to-noise ratio 32 dB); (c) fused OCT and PAM B-scan images at the same location. Ep, epidermis; De, dermis; Ca, cartilaginous backbone; BV, blood vessels; bar, 200 μm.