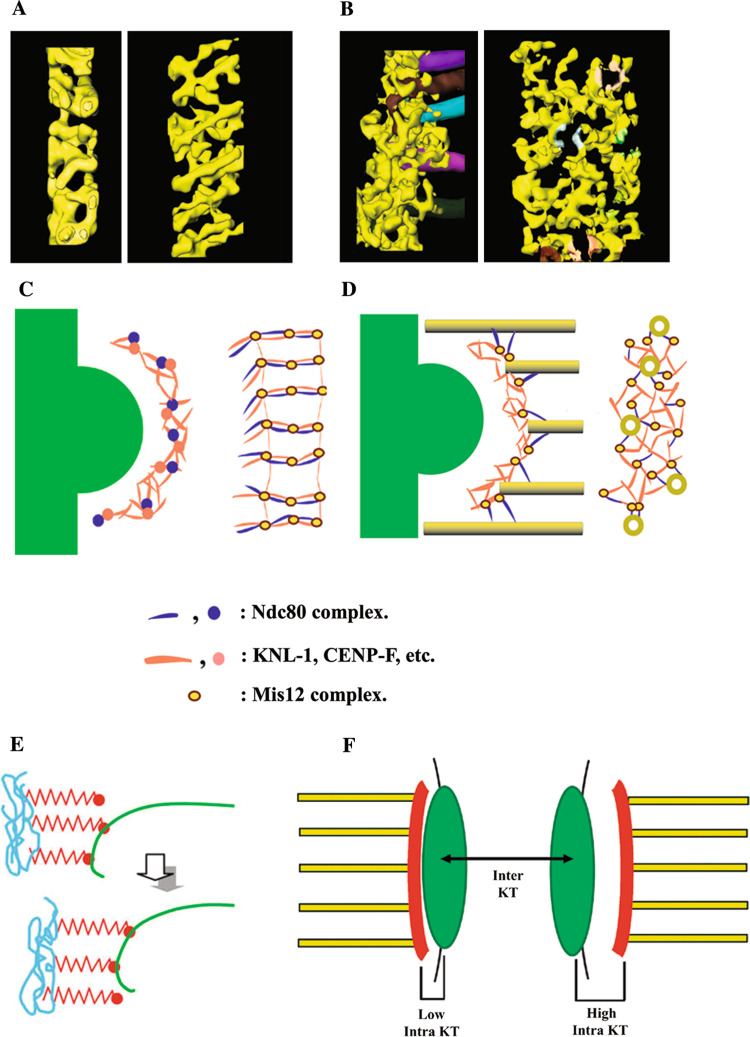
Fig. 5.
Illustrations of the outer plate network and kinetochore fibril models for kMT attachment. a, b Three-dimensional surface renderings of the outer plate in PtK1 kinetochores, based on the tracing of the outer plate fibrous components in kinetochores without (a) and with (b) kMTs. In each case, end-on views are shown on the left and en face views on the right with the outer plate network shown in yellow. Tracings of kMTs are shown in various colors in the edge view of the bound kinetochore in (b). The kMTs have been digitally removed from the en face view in (b), but shaded colors on the network fibers show where the corresponding kMTs insert into the outer plate. Note the dramatic reorganization of the outer plate upon kMT attachment. d Schematic illustrations corresponding to the surface renderings in a and b. A plausible arrangement for the KMN components is indicated by an assignment of shapes and colors in the key. e Illustration of the kinetochore fibril model. Kinetochore fibrils (shown in red) are thought to arise from chromatin in the inner kinetochore (shown in blue) and bind to the inner lumen of individual protofilaments of kMT plus ends (shown in green). In this way, the fibrils could restrict the curvature of the GDP lattice and harness some of the energy released from kMT disassembly for chromosome movement. f Illustration of how movement of the outer plate network relative to the underlying inner kinetochore could account for the intra-kinetochore stretch that is correlated with release of the spindle assembly checkpoint [71, 72]. Intra-kinetochore stretch is measured by labeling an inner kinetochore component (CENP-A) with GFP (location indicated by the green area in f), and an outer kinetochore component (Ndc80 or Mis12) with m-Cherry Red (location indicated by the red area in f). The hypothesized location of the outer plate (in red) in low and high intra-kinetochore stretch is indicated by “Low Intra KT” and “High intra KT” on the left and right sides of the figure. Inter-KT indicates the stretch between sister kinetochores, which is not correlated with checkpoint release. a–d Adapted from [49] with permission from Macmillan Publishers Ltd. e Reprinted from [50] with permission from Elsevier. f Reprinted from [73] with permission from Rockefeller University Press

