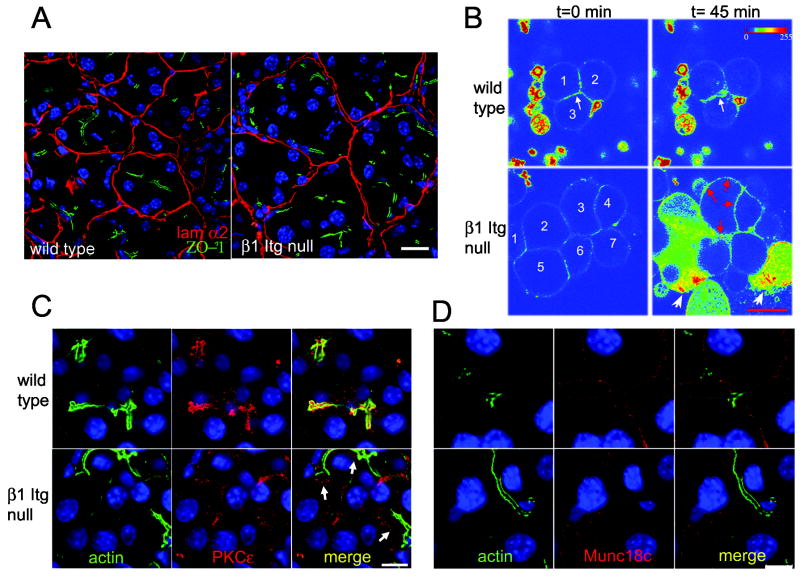
Figure 6. β1-Itgflox/flox;Ptf1a-Cre acini display defective cell polarity.
(A) 12 month old wild type and β1-Itgflox/flox;Ptf1a-Cre pancreata were stained for laminin α2 (red) and ZO-1 (green) to highlight BM and lumen, respectively. DAPI in blue. (B) Isolated wild type and β1-Itgflox/flox;Ptf1a-Cre acini were loaded with FM1-43 fluorescent dye and monitored by live cell fluorescent imaging. When fluorescence stabilized, 1nM caerulein was added. Shown is an intensity map pseudocolor (Zeiss LSM Image Examiner software). At time 0, fluorescent signal in wild type and β1-Itgflox/flox;Ptf1a-Cre acini were comparable. After 45 min, wild type acini showed increased apical fluorescence (white arrow). β1-Itgflox/flox;Ptf1a-Cre acini showed increased fluorescence at all cell surfaces (red arrows), displayed a discharge of membrane bodies, loss of cell integrity and release of intracellular content (white arrowheads). Numbers identify cells; unnumbered fluorescent bodies are membrane fragments not filtered out during preparation. Scale bar = 20 μm. Data are representative of 3 mice/genotype, 6-7 weeks of age. (C,D) 12 month old wild type and β1-Itgflox/flox;Ptf1a-Cre pancreata were co-stained for F-actin with phalloidin (green) and either PKCε(C, red) or Munc-18c (D, red) and DAPI (blue). Arrows in (C) indicate subluminal staining of PKCε in β1-Itgflox/flox;Ptf1a-Cre acinar cells.

