
Fig 1.
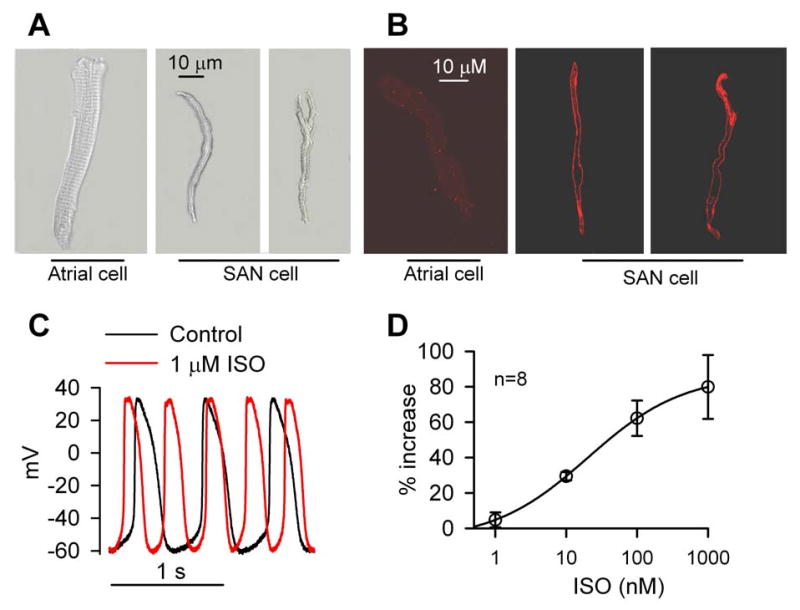
Typical features of isolated dog SAN cells. (A) Typical morphology of isolated atrial and SAN cells. (B) SAN cells showed prominent HCN4 staining, seen as green fluorescence, compared to atrial cells. (C) Representative action potential (AP) traces recorded before and after 1 μM isoproterenol (ISO). (D) ISO dose-dependently increased SAN cell AP frequency. The solid line shows the ISO – AP frequency relationship results fit with the Hill equation.