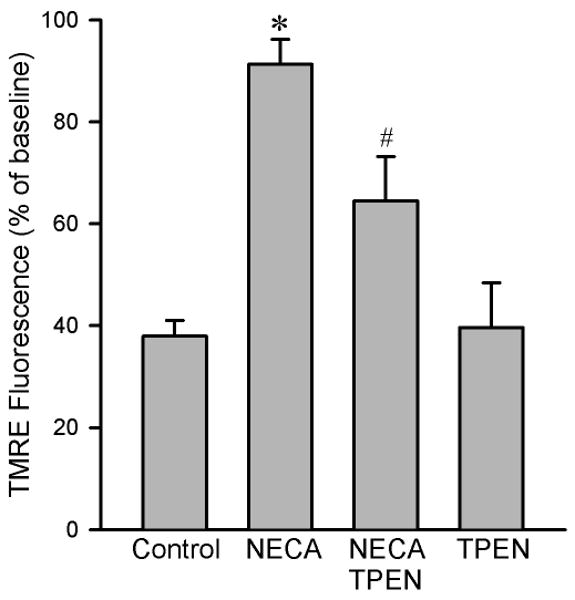
Figure 6.

Summarized data for TMRE fluorescence intensity 20 min after exposure to 100 μM H2O2 in isolated rat cardiomyocytes. NECA (100 nM, n = 7) prevented oxidant-induced TMRE fluorescence reduction compared to the control (n = 9), an effect that was attenuated by the zinc chelator TPEN (10 μM, n = 6). TPEN alone (n = 6) did not alter the fluorescence intensity. Three to 6 cells were analyzed in each experiment. * p < 0.05 vs. control; # p < 0.05 vs. NECA.
