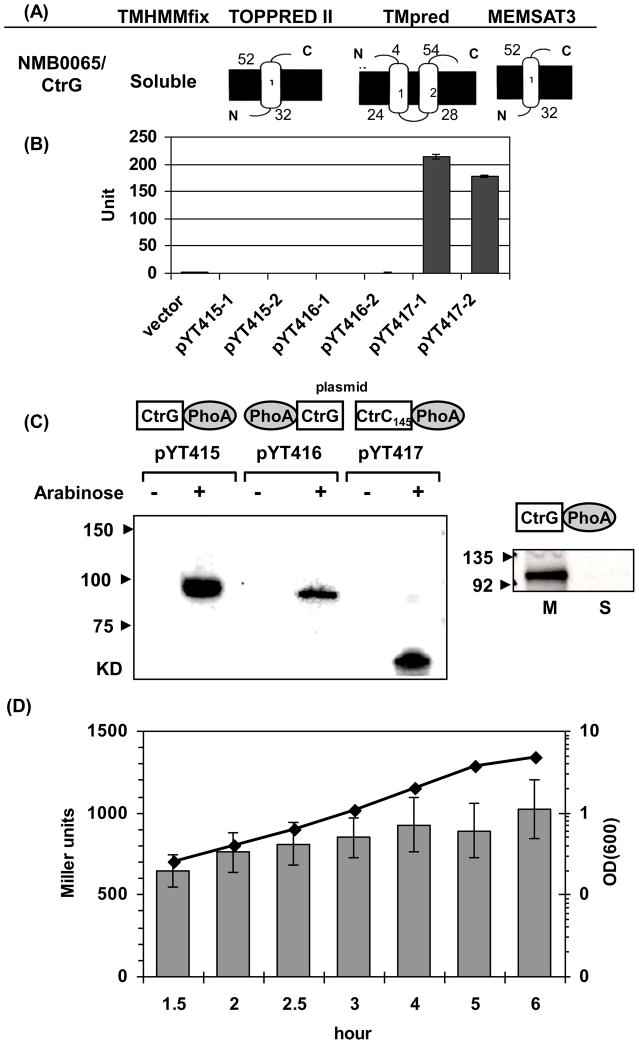
Fig. 2.
(A) Schematic topology predictions of NMB0065 using four algorithms. The inner membranes are shown as thick black lines and the residue numbers of the predicted transmembrane segments are indicated. (B) PhoA activity assays. Two independent plasmids for each construct were examined together with the empty vector control. The error bars represent the standard deviation of triplicate measurements. This is a representative of two independent experiments. (C) Western blots with anti-PhoA monoclonal antibody. Expression of PhoA fusion proteins in each plasmid construct (configurations shown above the plasmid name) was assessed with and without induction by 0.2% arabinose. Equal numbers of cells were examined in each sample (Left panel). Whole cell lysate of the E. coli strain expressing the NMB0065-PhoA fusion was separated into soluble protein fraction (S) and total membrane fraction (M) and probed with anti-PhoA antibody. Equal amount of proteins (20 μg) were loaded in each lane (Right panel). (D) The expression of NMB0065 is not growth phase dependent. The NMB0065::lacZ reporter integrated at a permissive locus in strain NMB427 was grown in GC broth and samples collected at various growth phases. Data presented are the mean values and standard deviations of four independent cultures. The line graph shows the OD600 values, while the corresponding β-galactosidase activities in Miller units were shown as gray bars. No significant difference in transcription was noted from the exponential to the early stationary phase.

