
Figure 4.
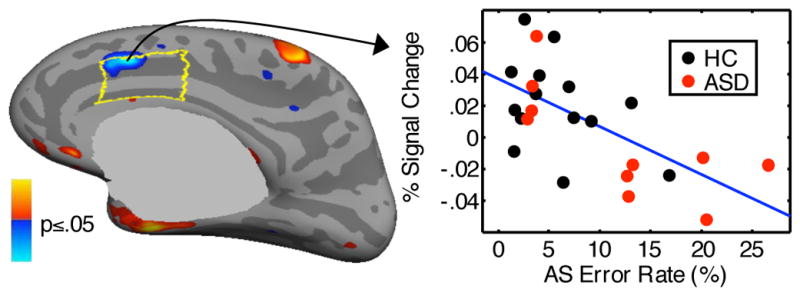
Statistical map of regression of activation at 4 s for the antisaccade vs. prosaccade contrast against antisaccade error rate. The map shows the significant correlation in the combined group. The scatter plot shows activation in the vertex with the most significant correlation in the right dACC, which is outlined in yellow.