
Figure 5.
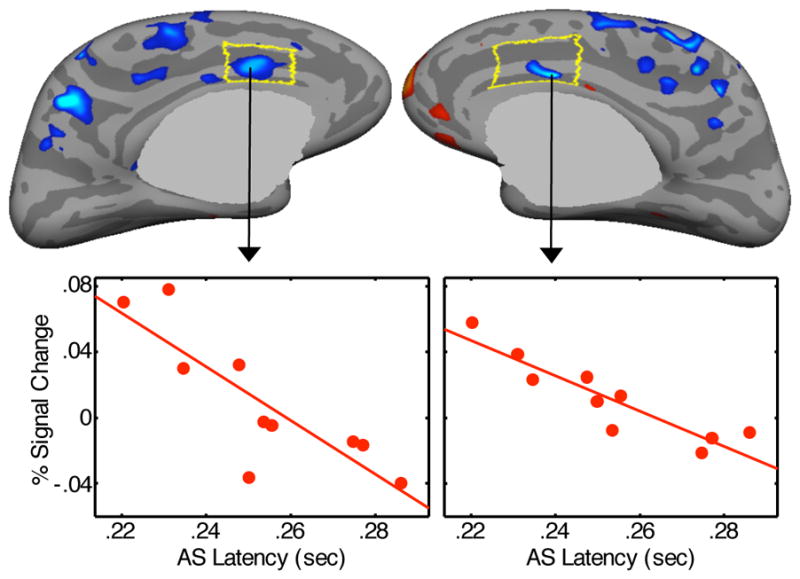
Statistical map of regression of activation at 4 s for the antisaccade vs. prosaccade contrast against antisaccade latency in the ASD group. Scatter plots show activation in the left and right dACC vertices with the most significant correlations.