
Figure 8.
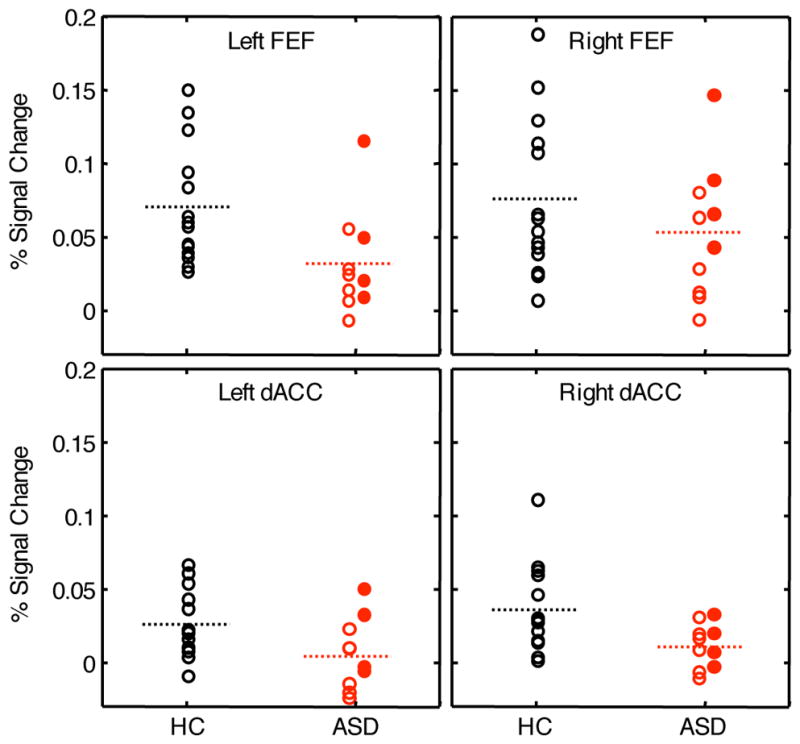
The effect of medication on inhibition-related activation in participants with ASD. Each panel shows mean activation across all vertices in each of the four ROIs for the control and ASD groups. The control participants, none of whom were medicated, are indicated by open black circles. Within the ASD group, unmedicated participants are indicated by open red circles, and medicated participants are indicated by filled red circles. The dashed lines indicate group means (with all subjects included).