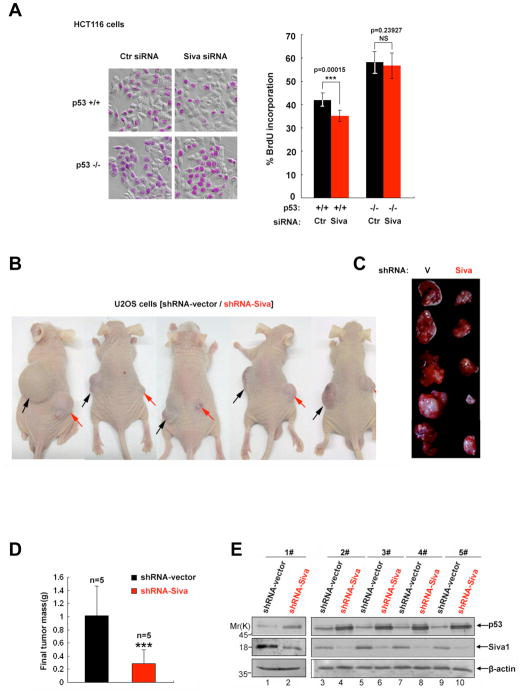
Figure 6. Down-regulation of Siva1 suppresses tumor formation.
(A) HCT116 p53+/+ and HCT116 p53−/− cells were pulsed with BrdU for 1 hour prior to fixation. BrdU immunofluorescence analysis was performed to determine the percentages of cells undergoing DNA synthesis. Cells were imaged in bright field to score total cell number. Error bars indicate standard deviations, *** = p<0.005, NS = no significant difference.
(B–D) Knockdown of Siva expression decreases tumorigenicity. (B) U2OS tumor cells expressing shRNA-vector control and shRNA-Siva (2 × 10⁶ for each side) were subcutaneously inoculated in dorsal left or right flanks of 5-week-old nude mice (n=5) respectively. Representative pictures of tumor bearing nude mice were taken 5 weeks after inoculation. (C) The volumes of all flank tumors excised from 5 mice were compared (n=5). (D) Histograms show data points representing average tumor weights for each treatment.
(E) Siva shRNA-expressing tumor showed higher levels of p53. Paired tumor samples (shRNA-Siva versus shRNA-vector) from five mice were analyzed by Western blotting to evaluate the expression of Siva1 and p53. β-actin was used as a loading control.

